
Tableau Course
I recently attended a 1-day course to learn how to use Tableau visualisation software, hosted by the Consumer Data Research Centre (CDRC) in the Leeds Institute for Data Analytics (LIDA). The CDRC let me attend for free, and in return I said I’d write a few notes about the course and the software.
On its website, Tableau says that it “helps the world’s largest organizations unleash the power of their most valuable assets: their data and their people”. The shorter version of that is, basically, that Tableau is software to visualise a nd analyse data. And mostly to visualise at that (for serious analysis you’re probably going to use something else like R or Python). But as for using Tableau as a data visualisation tool, I was very impressed!.
The course took us through some examples of how to use Tableau for some increasingly difficult problems. These were interesting and a good way to get the handle of using the software, but I spent most of the time using it on some other data that I’m interested in at the moment. In particular, Leeds City Council have released a load of footfall data from a few cameras that they have dotted around Leeds, and I was interested in trying to look at the flows of people around the city.
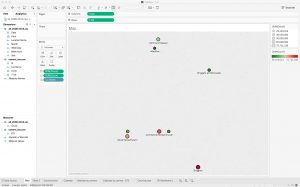
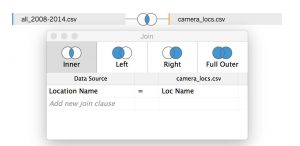
It was easy to load the camera data in (just by dragging) and to link it to the camera locations that I had stored as a separate file. Tableau works out which columns represent coordinates and then lets you map the data. The screenshot below shows the camera locations, the the colour and size of the dots determined by the total fooffall over the whole time period. The map is pretty rubbish at that scale, it is designed for regional or national mapping, but you can link to MapBox which will give you full control over the basemap. I didn’t do this, but imagine that it is a very useful feature (MapBox is great).
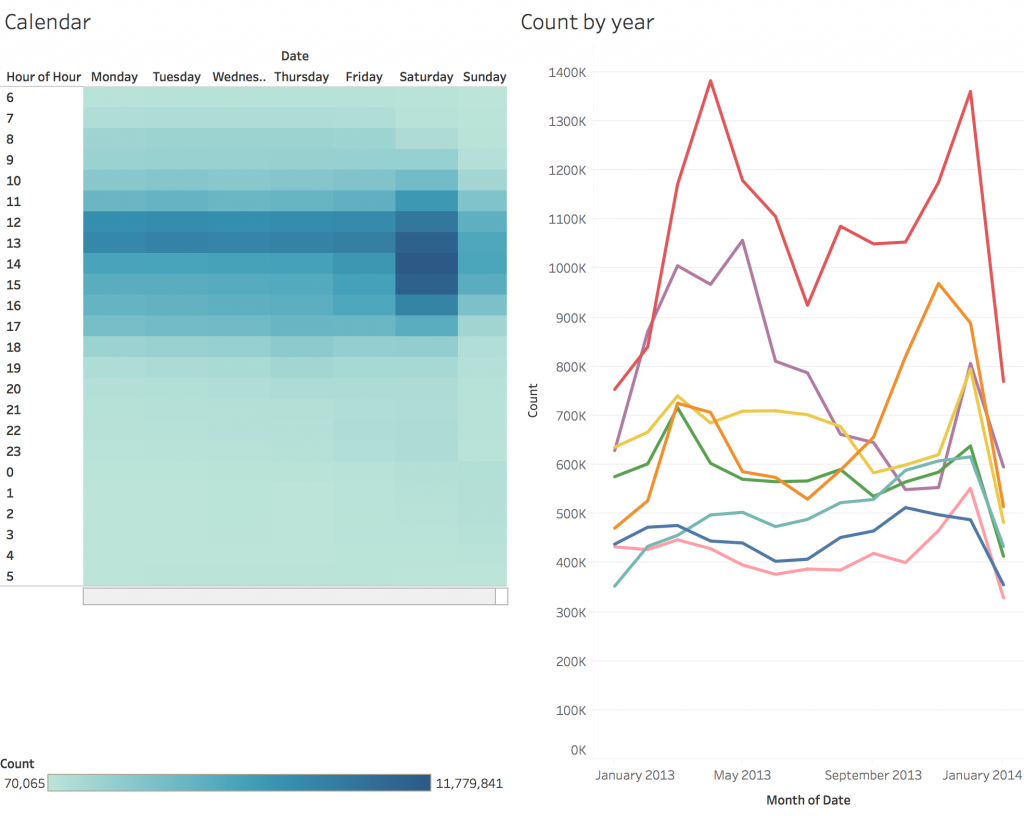
I then began to explore the changes in footfall over time, and this is when I was most impressed. Tableau parsed the time data properly (i.e. by not confusing dates and times for something like text), which was nice, but more importantly it made it incredibly easy to either look at trends over time (e.g. footfall per week over the last few years) or to aggregate to specific times (e.g. total counts on Mondays, Tuesdays, etc.). The figure below shows two examples of this. OK, you could do this with lots of other tools, but I was very impressed at how easy it was. There is also a ‘dashboard’ function that lets you combined plots and make images.
To summarise: I was very impressed with Tableau as a data visualisation tool. The one-day course is probably overkill for people who are fairly confident with modelling/visualisation tools already as it was generally pretty easy to use. But it was still nice to have a day messing around with some data. I don’t know what the price of Tableau is - as a lecturer I am lucky enough to have been given a free license - but if it is affordable then I would certainly recommend it as software to quickly do some useful visualisations of data.