
New Paper: The Victims in London Crime Hotspots
I’ve just had a paper published with my colleague Martin Andresen in the Journal of Criminal Justice (10.1016/j.jcrimjus.2016.03.002) that tries to work out which data sets give us the most accurate counts of the number of potential victims of street crime. The problem is that although we have great data about where people live (from sources like the census), we don’t know nearly so much about how many people are around during the day. This means that we can’t calculate crime rates, and therefore don’t know which areas have lots of crime because there are lots of potential victims, versus those that have lots of crime even though there are very few potential victims.
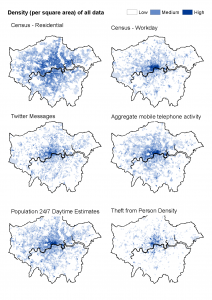
The paper looks at 5 data sets: the residential census population, the workday census population, Twitter messages, aggregate (anonymous) mobile phone activities, and population estimates from the Population 24/7 project. It found that the census workday population was the most highly correlated with the crime data, which is very good news on the whole. The census data are robust and publicly available, so can easily be used by others.
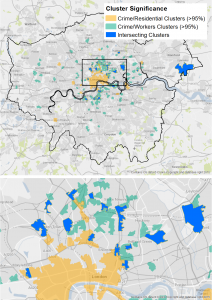
The paper also looked at where different types of clusters emerged after using the different data as the denominator in crime rate calculations. As expected, the city centre cluster dissolves once you take the huge number of visitors into account. There are some interesting clusters outside the city centre (where you have a surprisingly large volume of crime given the small ambient populations) that warrant further investigation.
Malleson, N., and Andresen, M.A. (2016) Exploring the impact of ambient population measures on London crime hotspots. Journal of Criminal Justice pp 52-63 DOI: 10.1016/j.jcrimjus.2016.03.002