Big Data:
A 'Revolution' for Understanding and Modelling Micro Behaviour (?)
Dr Nick Malleson
School of Geography, University of Leeds
http://nickmalleson.co.uk/
http://www.geog.leeds.ac.uk/people/n.malleson
Slides: http://mass.leeds.ac.uk/html/slides/Lipari2014/
Recap
Cities are complex systems
Exhibit emergence, non-linear dynamics, feedback loops, etc.
Driven by micro-interactions
Cities are complex systems par excellence, more than the sum of their parts and developed through a multitude of individual and collective decisions from the bottom up to the top down (Batty et al., 2012).
Individual-level models (e.g. ABM) can capture these properties
This makes them essential for understanding urban dynamics and designing 'smart' cities
BUT: data to understand individual behaviour are hard to come by
The 'Big Data Revolution' might help...
Caveat
You will see lots of question marks in these slides.
This is because there is still a lot of discussion about the impact that 'big data' and 'smart cities' will have on societies.
The lecture is posing questions, rather than answers!
Outline
Data Collection: Background
1880 U.S. census took 8 years to tabulate!
1890 census used punch cards and tabulation machines (Batty et al. 2012)
Technology is making it possible to collect and analyse larger data sets
But still often need to rely on sampling for collection
Fortunately, random samples are often sufficielty representative
BUT: sampling breaks down when we want to identify small sub-categories
Better to have all data. With new technology, insight and methods, this is becomming possible for a range of fields.
N=all (Mayer-Schonberger and Cukier, 2013)
Abundance of Data
Quiz
What kinds of information about individuals can are being captured right now?
social media (Facebook, Google, Twitter, etc)
movement data: Oyster cards, ANPR, air passengers ...
internet search terms
mobile telephone locations
market research
spatial data (Open Street Map etc.)
transaction data (loyalty cards, shopping habits, etc.)
patient data
schools data
sensed data: air quality, satellite imagery, noise levels ...
Abundance of Data
What data are being captured about you?
The Abundance of Data

In general, the amount of data being created by, and about, humans is proliferating.
90% of the world's data has been generated in the last two years ( Science Daily)
The amount of data is doubling every two years (EMC).
Total data will hit 8 zeta bytes by 2015 ( Silicon Angle).
If this were printed out on double-sided A4 sheets the pile of paper would stretch to the moon and back 10,000 times! (I've made this up so probably not one to quote, but you get the idea..).
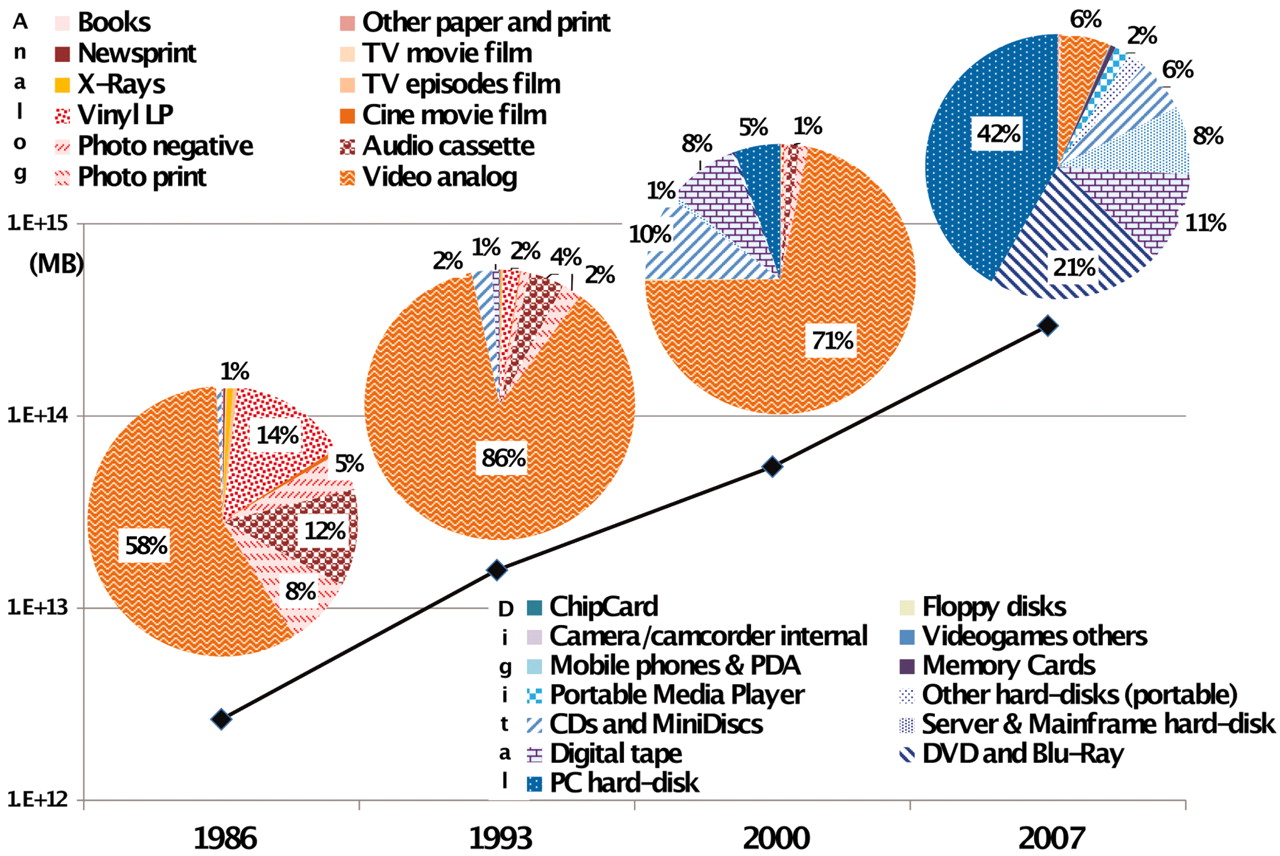
Originally published in Science Express on 10 February 2011,
doi: 10.1126/science.1200970
Science 1 April 2011: vol. 332 no. 6025 60-65
World Information Capacity
Video draws interesting parallels with biological data processing capabilities. ( https://www.youtube.com/watch?v=iIKPjOuwqHo).
Outline
The Big Data "Revolution"
This abundance of new data is changing the way that we view the world.

In the physical sciences:
"Data intensive science" (e-science) (Gray, 2007)
Astronomy - Data are pooled in Virtual Observatories (VOs)
CERN Large Hadron Collider "CERN does not have the computing or financial resources to crunch all of the data on site" (CERN)
The Big Data "Revolution"
In business
Loyalty cards etc - greater knowledge about customers
E.g. predicting pregnancy and telling your parents! (take with a pinch of salt)
Hidden value to 'secondary' / 'exhaust' data
Online browsing behaviour
Re-Captcha (digitising books)
Street view (Google self-driving car, improved mapping, wireless locations)
The Big Data "Revolution"
In medicine:
Do mobile phones cause cancer?
Mobile phone data (Danish Cancer Society)
N≈all - all cancer data and almost all mobile phone users (3.8 million person years)
If you want to know whether mobile phones cause cancer, have a look at the study: http://www.bmj.com/content/343/bmj.d6387
Abundance of patient data
When patients take multiple drugsm unexpected interactions can occur
Tatonetti et al. (2011) mine FDA adverse event reporting system (AERS) data.
Find unexpected relationships between combinations of drugs and glucose levels
Google Flu Trends (Nature, 2009)
Identify particular search words linked to emergence of a flu cluster
Able to predict new clusters rapidly (1 day vs. 1-2 weeks with traditional methods)
(More recent accuracy is questionable)
The Big Data "Revolution"
In the social sciences:
"Datafication" (Mayer-Schonberger and Cukier, 2013)
friends, favourite places, moods, thoughts
Location as data
(particularly relevant to geographers)
'Crisis' in the social sciences
Data Collection
Collectors are everywhere!
E.g. Smart phone sensors
Accelorometer and gyroscope
GPS
Temperature, humidity, pressure
More on the way...
Air quality, UV light, earthquakes
Crowd-sourced data
Life tracking
'Big Data' Characteristics
Volume
There is lots of it!
E.g. Public transport journeys (Oyster): 3.5M daily tube journeys (not including busses, cycle hire, etc.). Mobile telephones: ~5Bn events daily.
But could be much smaller (N=all)
Variety
Extremely diverse sources and varied content within sources.
'Exhaust' data not created for a particular purpose (unlike traditional surveys)
Do the data tell us anything about the real world?
Low signal to noise ratio
Velocity
Data streams, rather than static databases
Often created (and necessarily analysed) in real time (c.f. climate models)
Big data quiz
Which of the following do you think could be classified as 'Big Data'? (Think about volume, variety, velocity)
Mobile telephone data
Census data
The Annual Business Survey
Open Street Map data
UK business tax returns
MasterCard purchases
Loyalty card data (e.g. Clubcard, Nectarcard)
The scorer of every recorded Premiership goal
A new research paradigm?
Correlation rather than causation
Don't need to understand why something is happening, only that it is happening.
e.g. Google Flu Trends
Data-driven rather than hypothesis-driven -- letting the data speak
"The End of Theory" (Anderson, 2008)
Lower sampling bias, can accept lower data accuracy
With so much data, accuracy is less important (?)
A Crisis for Social Scientists?
Savage and Burrows (2007) have commended on a "coming crisis" for empirical sociology.
The field has traditionally prided itself on developing statistical methods that can identify generalisable rules from small amounts of neat, well structured data.
These small surveys are potentially being superseded by massive "crowd-sourced" databases that monitor activity patterns
Outline
Urban Research at Leeds
Recent work recognises the complex characteristics of cities (e.g. Batty, 2005)
Strong potential of individual-level methods (e.g. ABM)
BUT data are often insufficient
Excellent residential (night-time) population data (from censuses etc.).
Limited ambient (day-time) population data.
Potential for 'big' data sources to shed light on daily urban dynamics
Importantly, there is the potential to learn about real behaviour
Example: Research with Twitter data
Surge in volume of contributions to social media
66% of online adults use social media (Smith, 2011)
100 million active Twitter accounts in 2011 (Twitter, 2011)
270,000 tweets per minute produced worldwide in 2012 (TechCrunch, 2012)
Accurate time stamps and (occasionally) spatial location
Combination of text, media, location, etc.
Potentially powerful source of data for urban dynamics
What's in a Tweet?
The Twitter Application Programming Interface (API) provides full (?) access to Twitter data
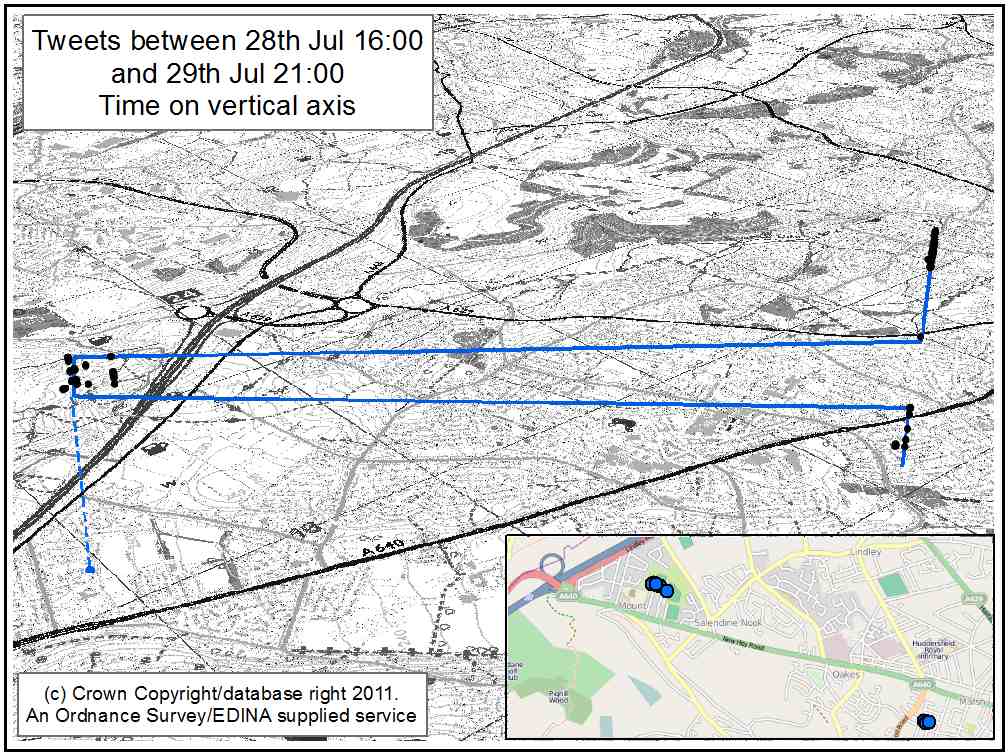
Leeds Twitter Data
Leeds, UK
Population 757,655 (in 2012)
Central shopping / leisure / commercial area
University and students
Social media data
Geo-located Twitter messages from 22 June 2011 to 14 April 2013
N=1,955,655 (after cleaning)
Two research directions:
1 - Simulating daily urban movements
2 - Populations at risk of street crime
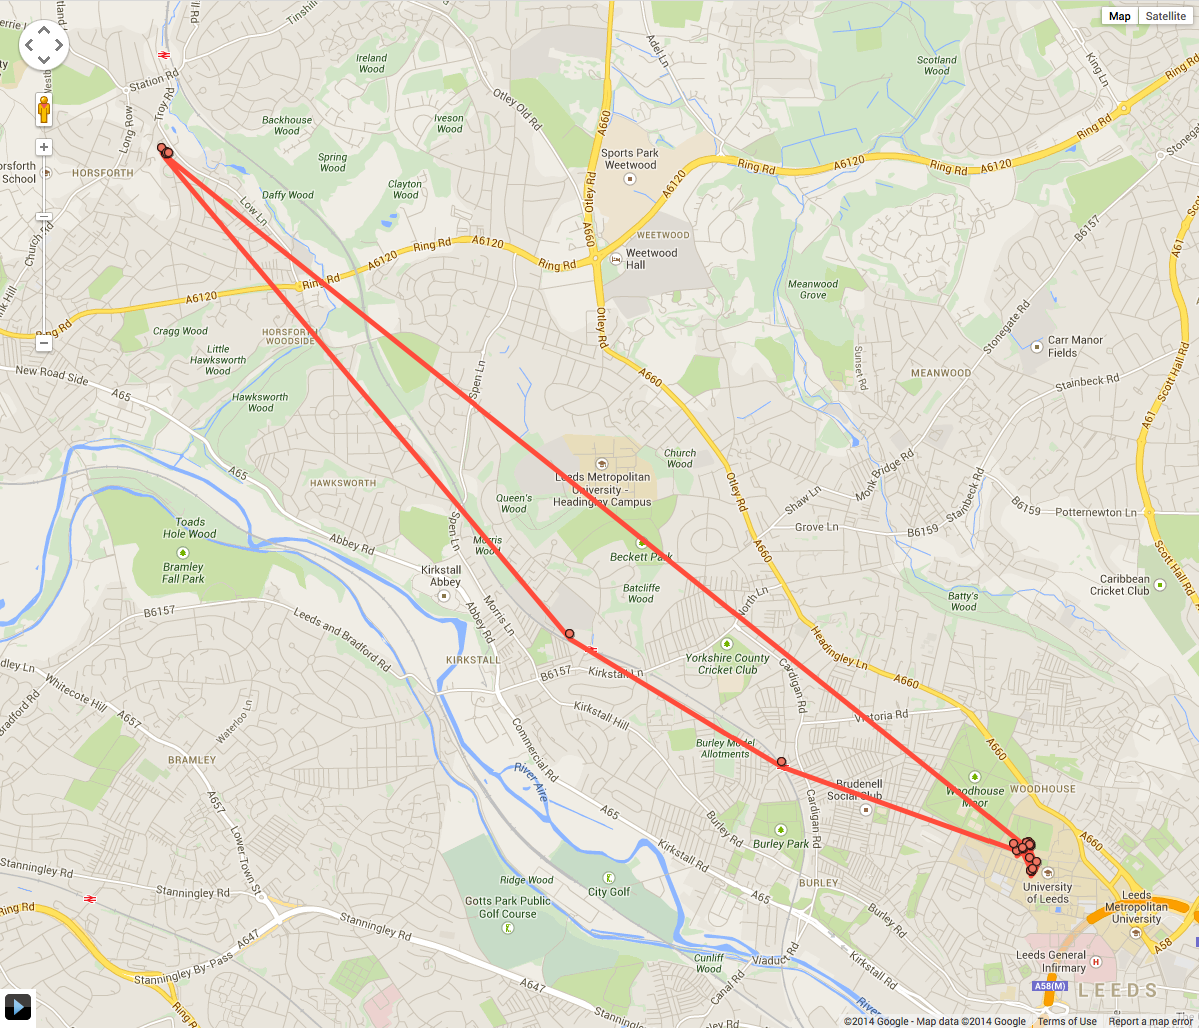
1 - Simulating daily urban movements
Simulating daily urban movements
To begin with: Using twitter data to better understand how people use urban spaces
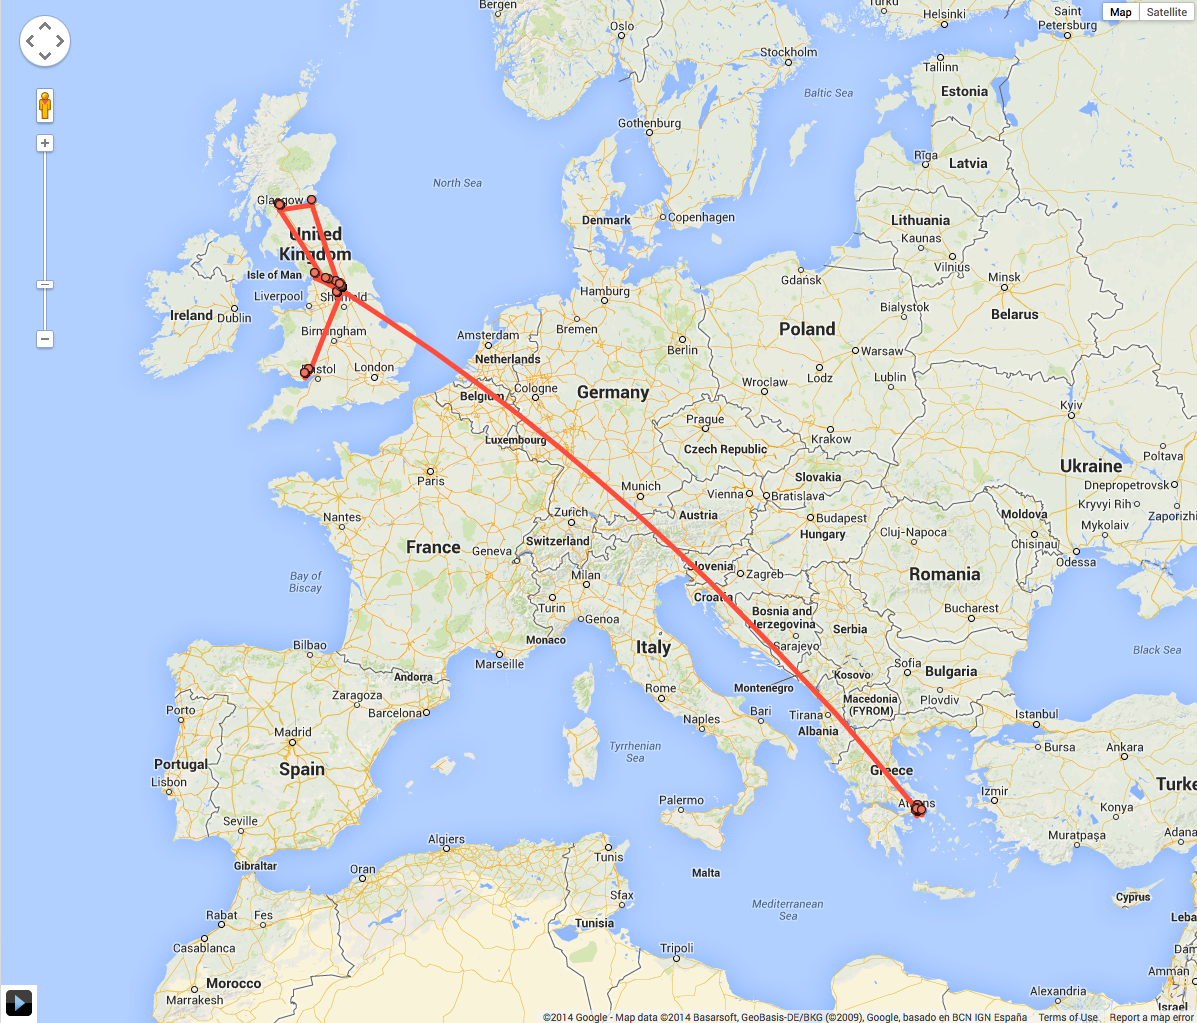
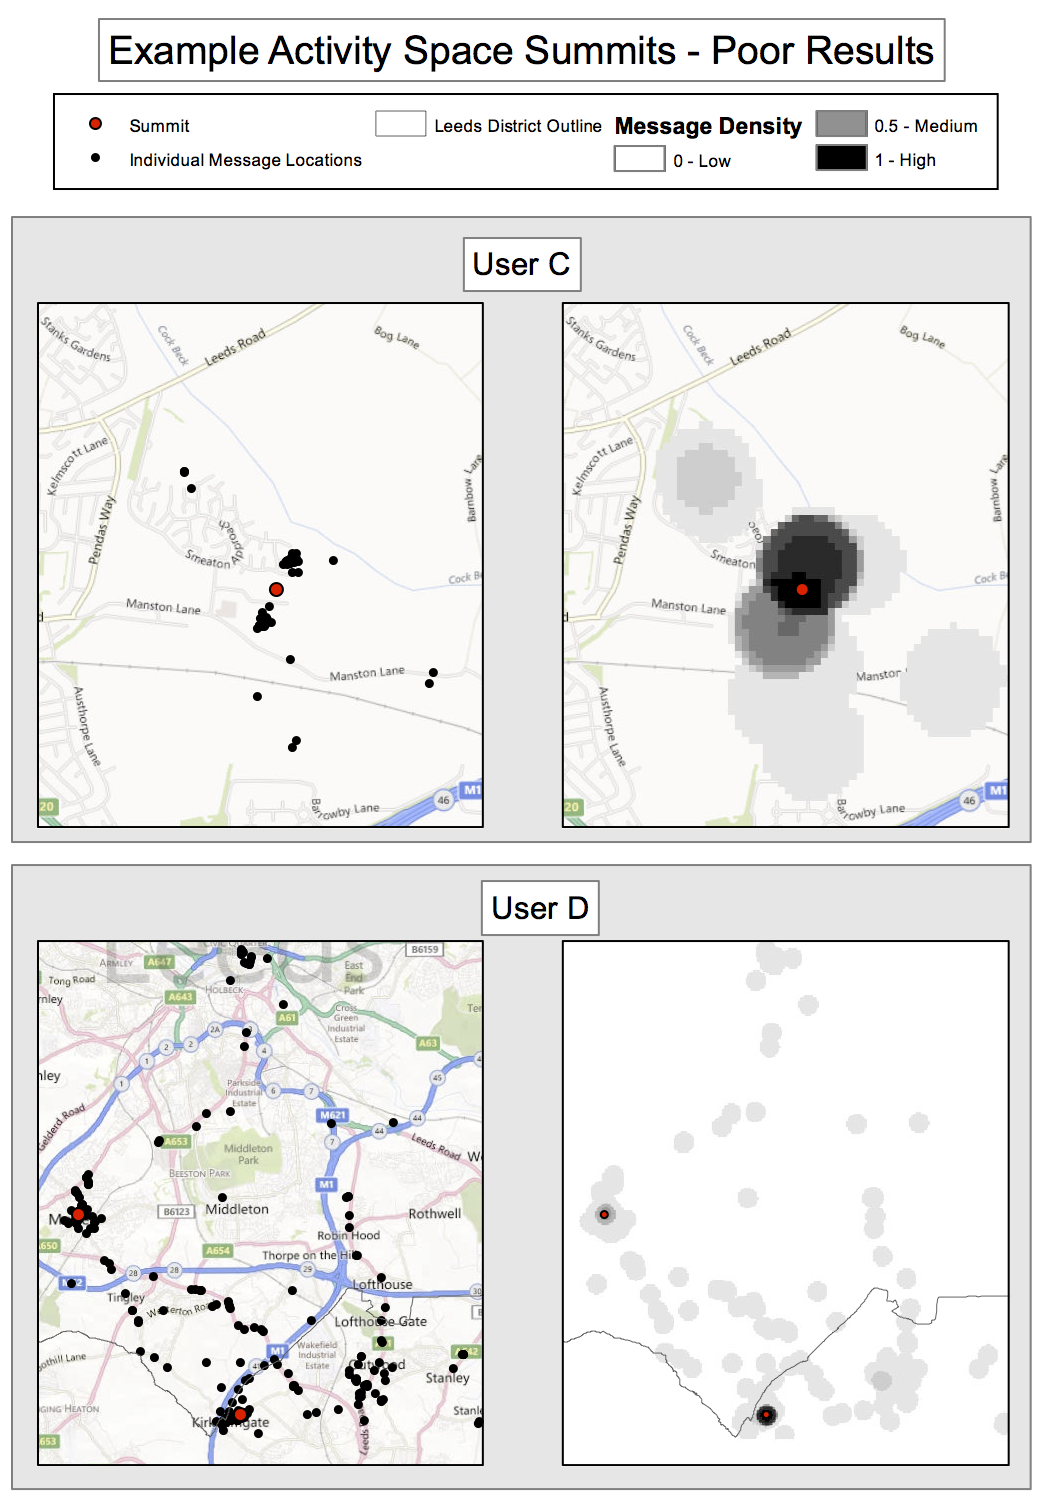
Stage 1: Extract prolific users
Simulating daily urban movements
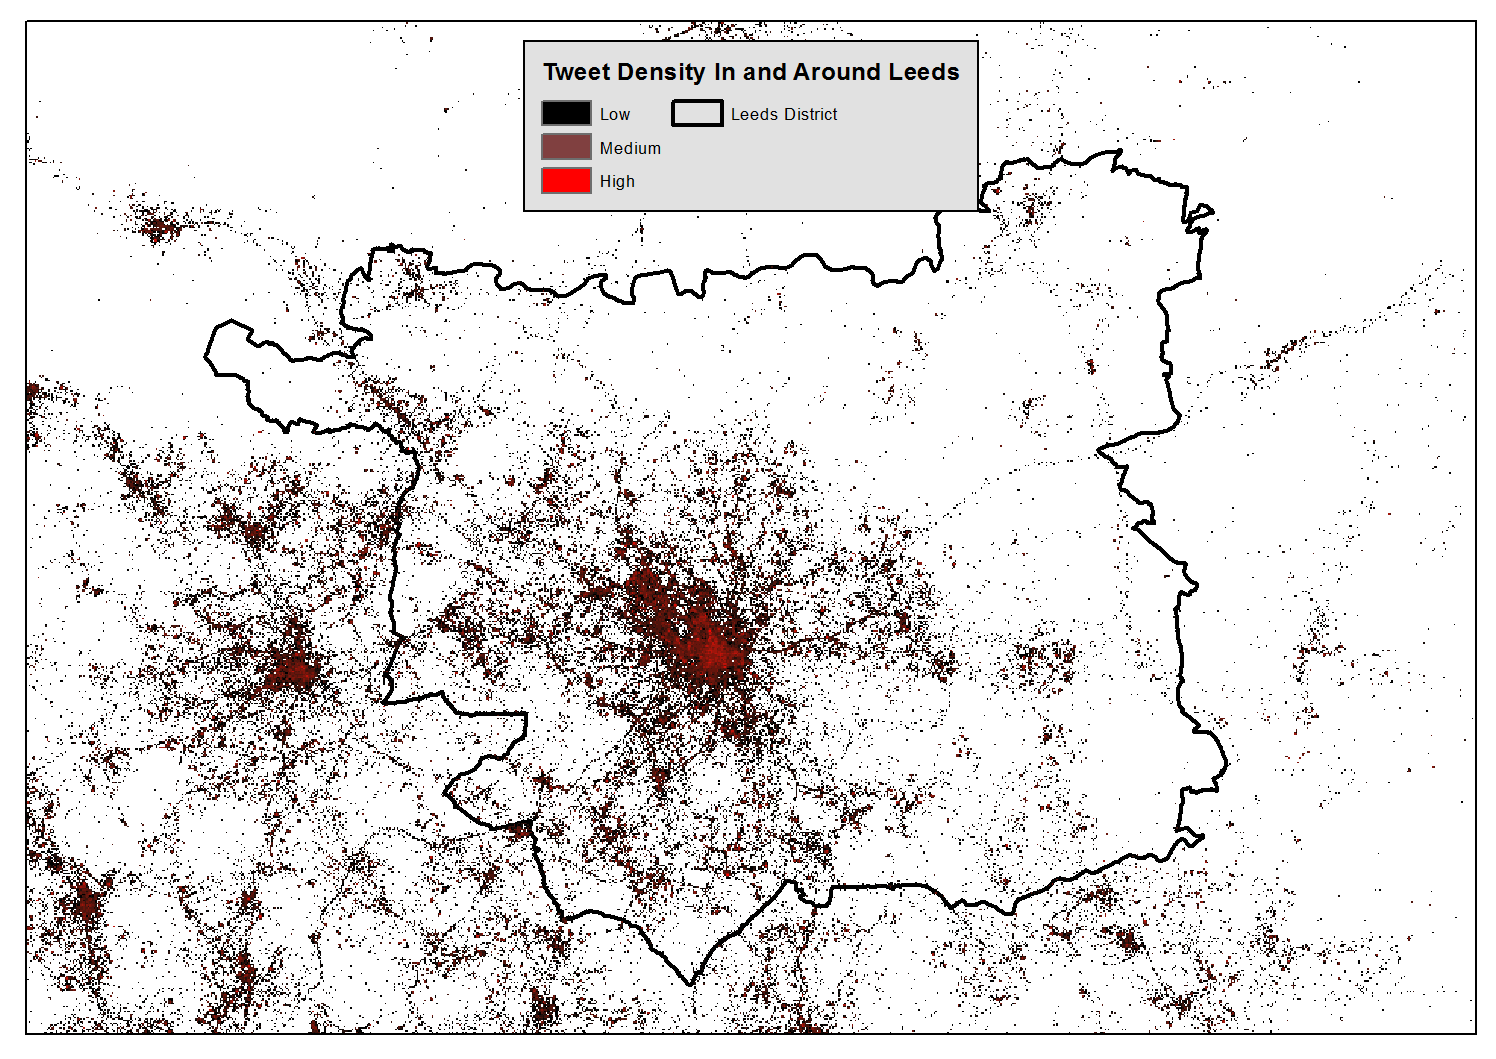
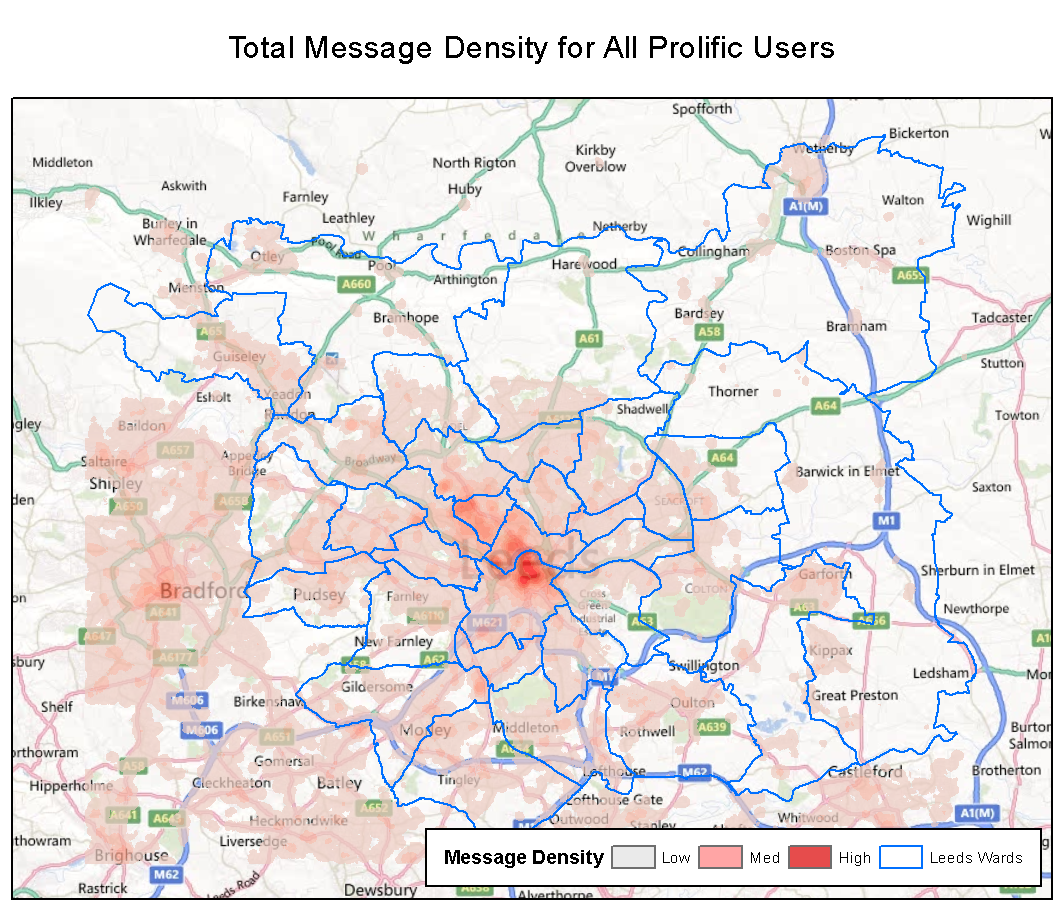
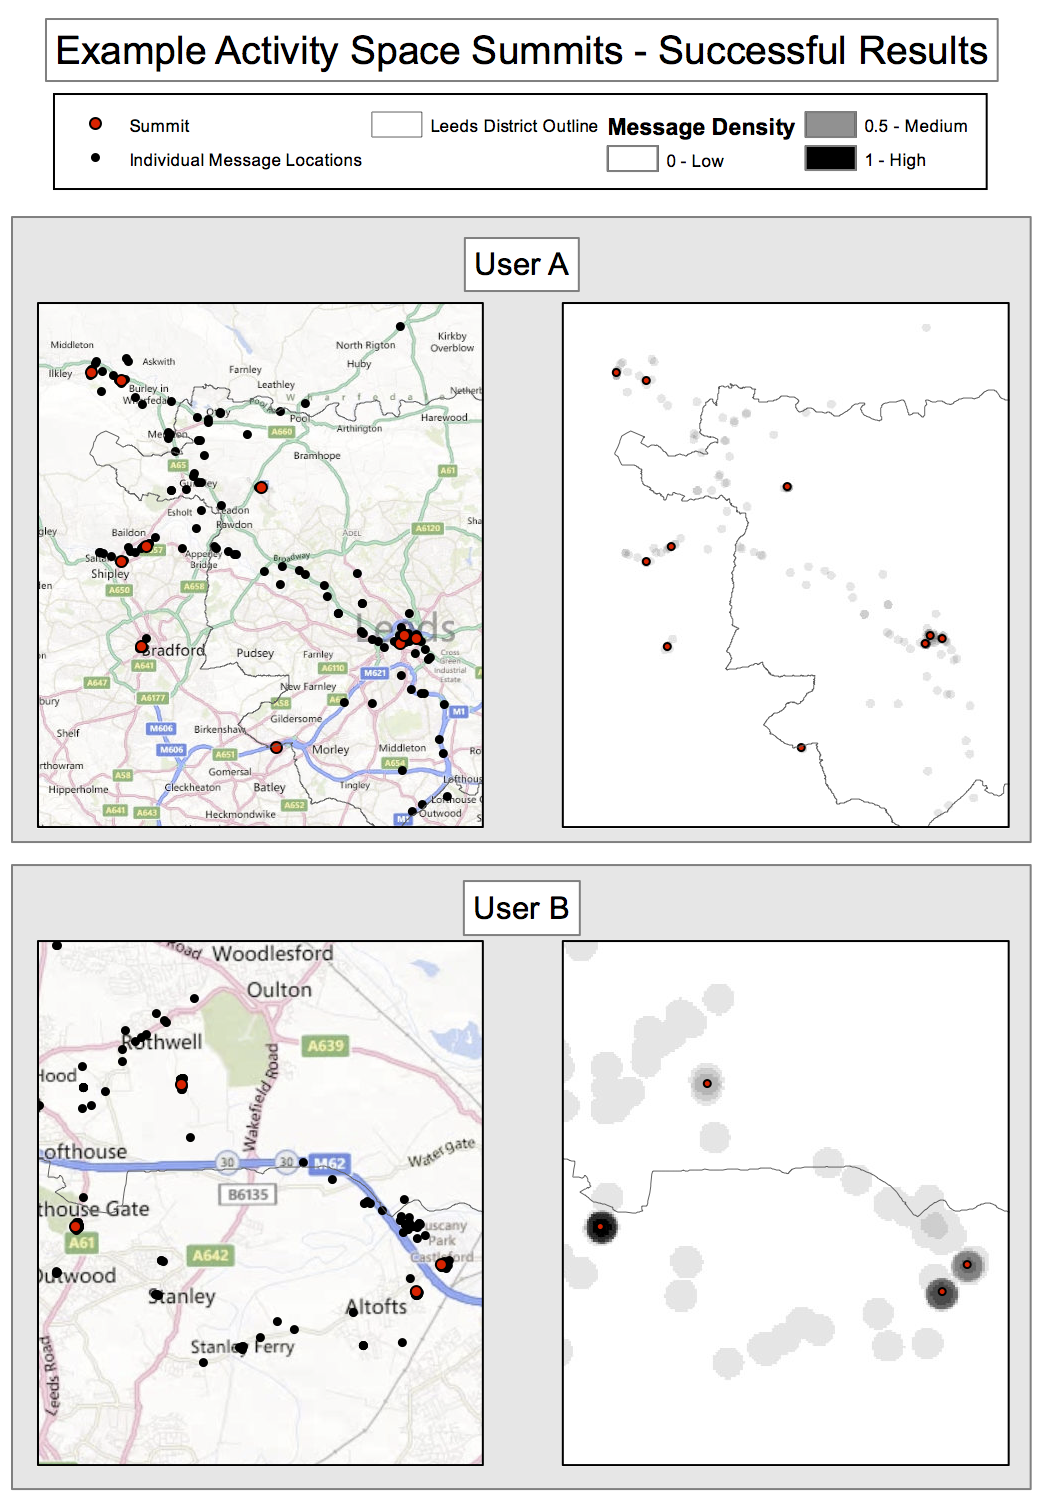
Stage 2 - Generate a message density surface
Kernel density estimation
Highlight areas with high spatial message density for individual users
Simulating daily urban movements
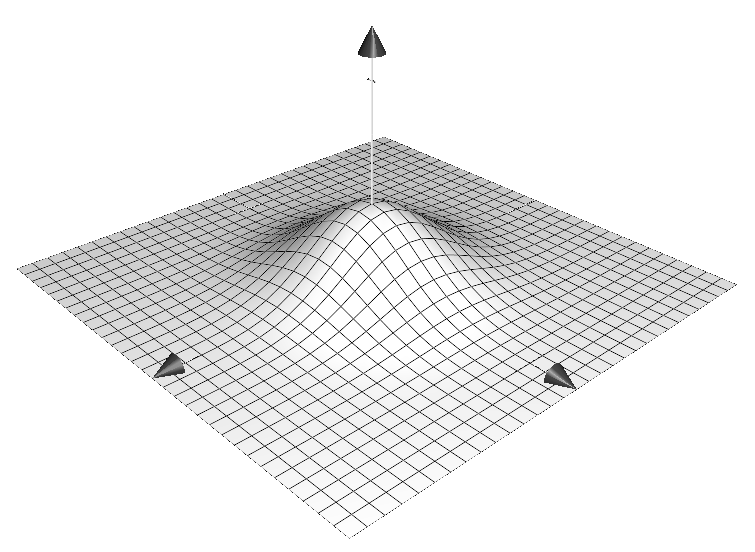
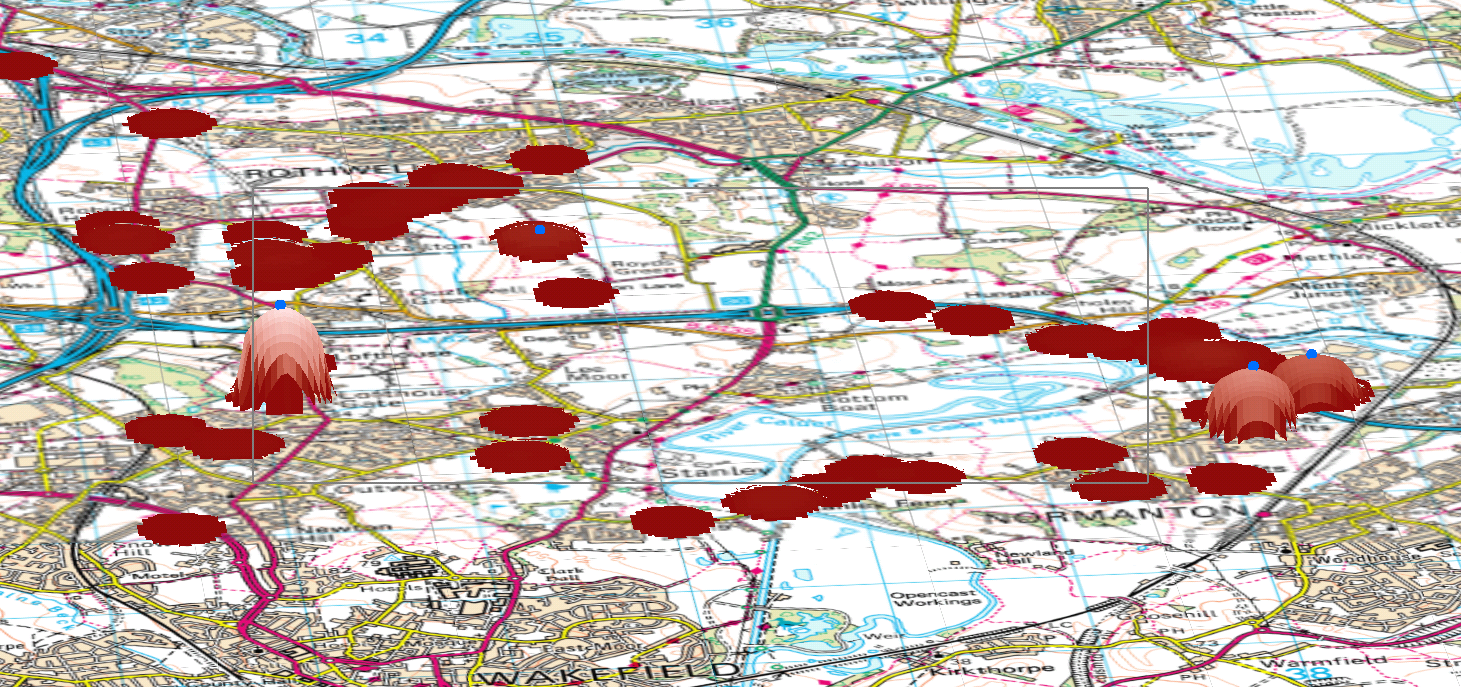
Stage 3 - Identify areas of 'unusually' high density (anchor points)
GIS method used to identify peaks in digital elevation data
Use Landserf free software (Java) [11]
Anchor points are centres of peaks
Assume highest peak is 'home'
Towards a Model of Daily Urban Movements
We have:
Sufficient compute power to simulate millions of agents
Reliable methods to capture complex phenomena (e.g. ABM)
We need:
More information about behaviour!
But, maybe we now have sufficient data..
Social 'big' data might be the missing link
2 - Populations at risk of street crime
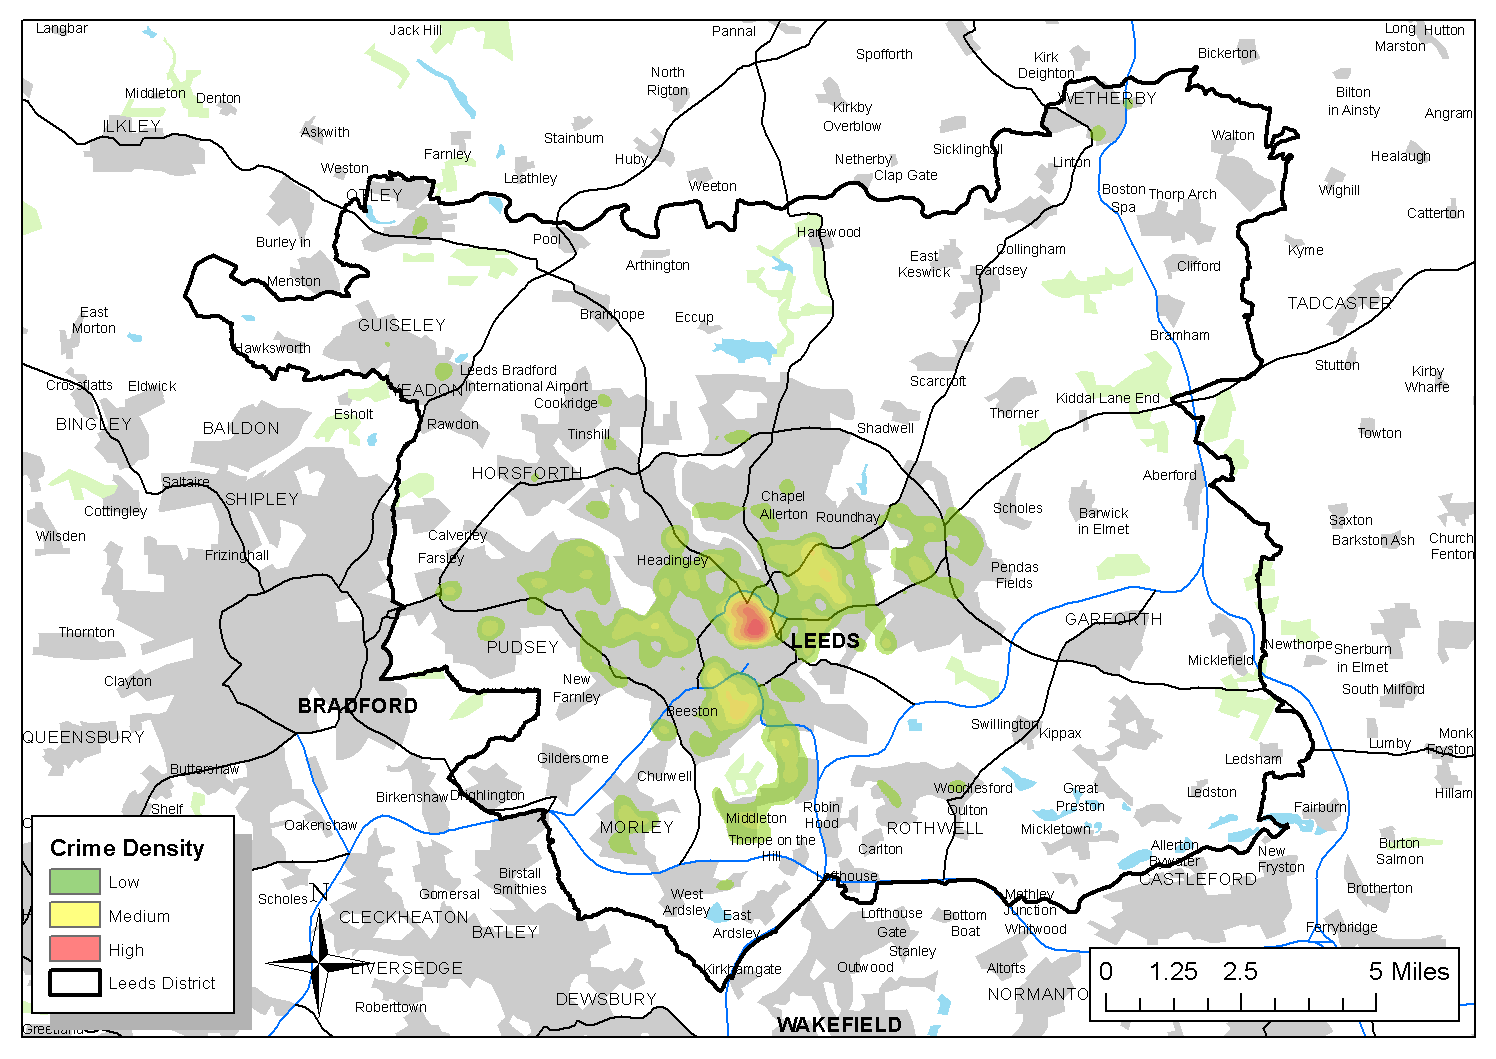
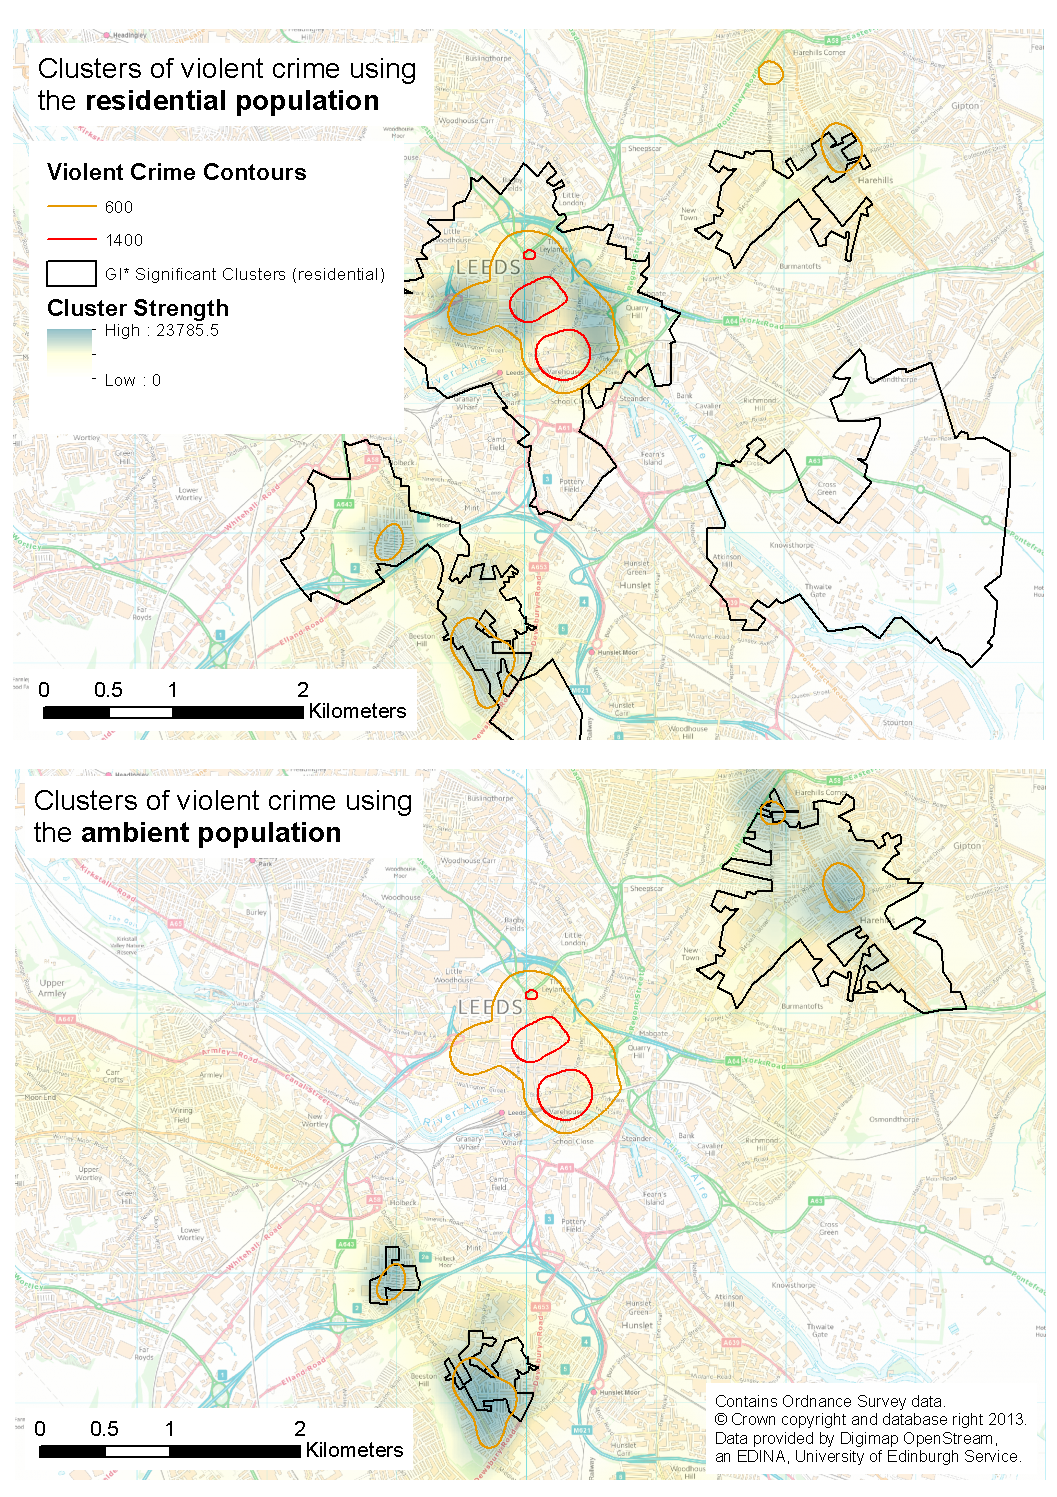
Are crime hot spots stable under the application of different population-at-risk measures?
Which areas have the highest crime rates when using both residential (census) and mobile (social media) population at risk data?
The Population-At-Risk in Crime Analysis
The population at risk is fundamental for crime rate calculations
CrimeRate = Crime Count / Population At Risk
No consensus on the best population-at-risk measure to use
“a valid rate ... should form a probability statement, and therefore should be based on the risk or target group appropriate for each specific crime category” (Boggs, 1965)
Usually default to residential population
Residential Population
OK for some crime types
E.g. Burglary
But not for many others. E.g.:
Assaults (Boivin 2013)
Robbery (Zhang et al. 2012)
Violent crime (Andresen 2006, 2011)
Why residential?
Data availability and resource constraints
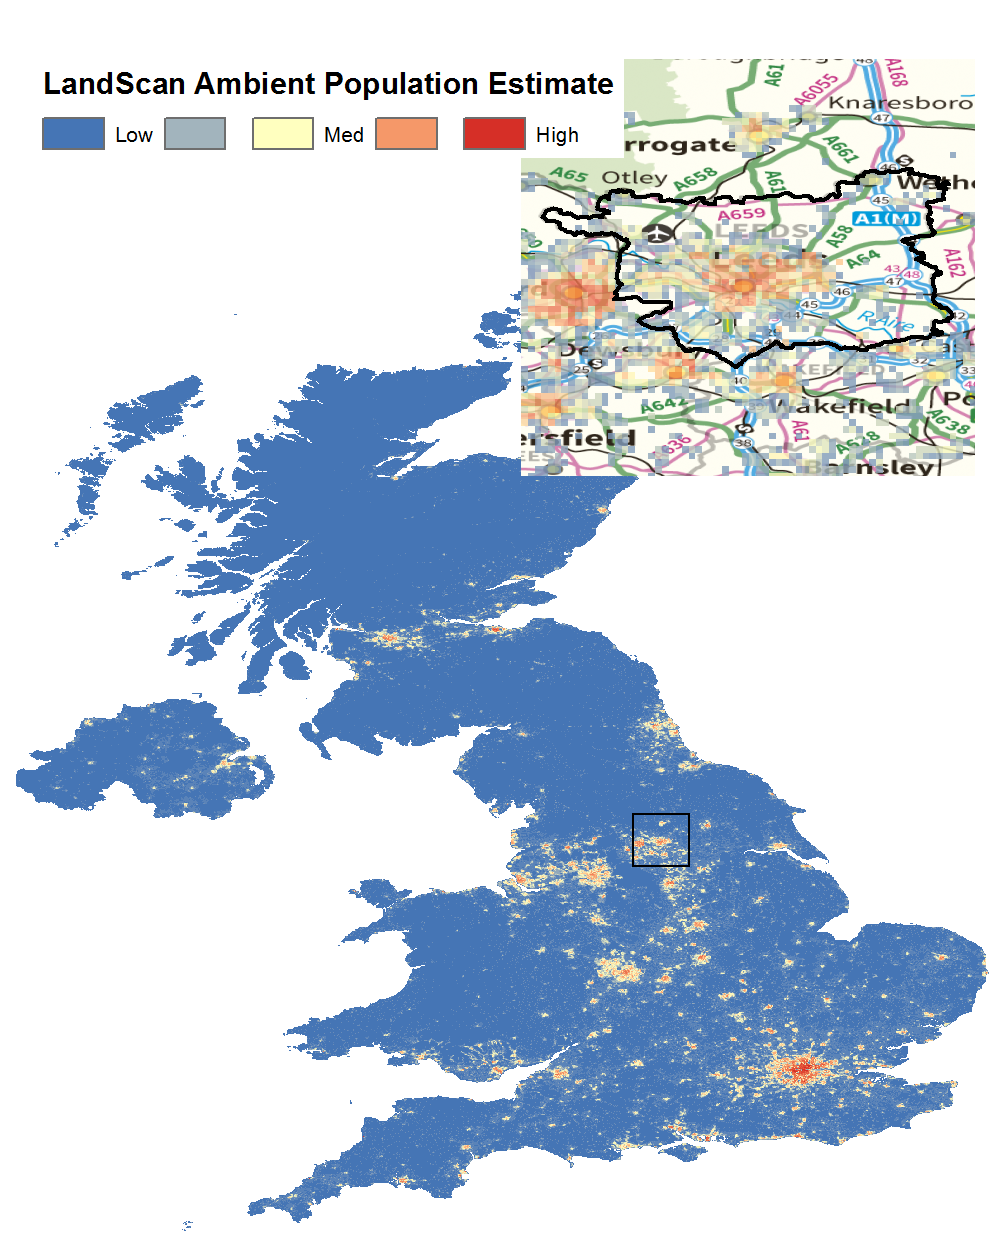
More recent attempts to estimate the ambient population:
Proxies (Boggs, 1965). E.g. car park locations, pavement area, etc.
LandScan data (Andresen et al. 2012). Global estimates of average (24hr) population, resolution ~1km2
Social Media - Limitations
What are some of the limitations of research with social media?
Messiness / Noise
Not gathered using systematic / statistically guided methodology
Omissions are commonplace
No systematic corrections
Generalisability
The digital divide
E.g. higher socioeconomic status groups are over represented in Twitter and Flickr (Li et al., 2013)
Bias
Over-representation of the most prolific users
Or certain activities
Research with Social Media: Conclusions
Lots of limitations, but considerable potential:
Biased at present, but use of social media is rising
Important methodological progress
Best available data?
Considerable investment from the Government and Research Councils. E.g. the Consumer Data Research Centre at Leeds
Outline
Why 'Smart Cities'?
By 2030, the population living in UK cities is expected to rise from 79% (1950) to 92.2%
The Guardian, using World Resources Institute data)
Worldwide, the proportion is estimated to rise from 40% in 1990 to 70% by 2050
What are 'Smart Cities'?
We have seen how much (new) data are available
This is being used by businesses and by researchers
It could also be put to good use at improving the lives of people in cities
What are 'Smart Cities'?
Some definitions.
Smart city is a term that gets together in an integrated way those initiatives oriented at improving the quality of life, sustainability and efficient management of services while innovating in relation to the materials, resources and models used and using technology in an intensive manner. (CTECNO 2012)
[A city] that uses information and communications technologies to make the critical infrastructure components and services ... more aware, interactive and efficient (Belissent 2010)
A city [is] 'smart' when investments ... fuel sustainable economic growth and a high quality of life, with a wise management of natural resources, through participatory government. (Caragliu et al. 2009)
... the urban center of the future, made safe, secure, environmentally green, and efficient because all structures ... are designed, constructed and maintained making use of advanced, integrated materials, sensors, electronics, and networks which are interfaced with computerized systems comprised of databases, tracking, and decision-making algorithms. (Bowerman et al. 2000)
What are common to all of these definitions?
What are 'Smart Cities'?
'Smart Cities' are characterised by:
Abundance of data
Technologies for interpretation and adding value
Simulation
Visualisation
Animation
etc.
Mechanisms for feedback and control
Lots of examples to follow...
Outline
Intelligent Rubbish
Finding new ways to understand urban dynamics ...
(example from the Trash Truck project)
Intelligent Traffic Systems
Stockholm becomes 'Green Capital'
Part of this thanks to intelligent traffic systems designed with IBM:
To help Stockholm overcome its traffic congestion problems, IBM helped them develop a road charging system that covers a 24-square-kilometer area of the inner city with 18 barrier-free control points equipped with cameras and a mix of payment channels. This project resulted in a 50 percent drop in morning traffic waiting time, an increase of 60,000 passengers per day in public transportation ridership and an overall improved quality of life for the residents of Stockholm.
Intelligent Traffic Systems
Or you could go one step further...
City Dashboards - London

A way to collect and present data from a variety of different sources
Become an integral part of urban planning and management?
Support a feedback loop; people make decisions based on dynamic, real-time data.
Empowering citizens with knowledge about where they live?
City Dashboards - Leeds
City Dashboards - Singapore
Or, if you are MIT, the dashboard looks more like this...
A project as part of the MIT Senseable Cities Laboratory.
Efficient Parcel Delivery
Not all projects are still in planning, some are a reality.
UPS adopted a new route-finding system called ORION (On-Road Integration Optimisation and Navigation)
Massive data-crunching algorithm (all trucks have sensors)
Optimises parcel routes (even trying to avoid left turns)
Some numbers ( Wired magazine):
85 million miles saved
15 trillion trillion (15,000,000,000,000,000,000,000,000) possible routes for a driver with 25 packages
$30 million saved per year if each driver travels one fewer mile each day.
Outline
Ethical Implications
What are some of the ethical implications associated with the use of Big Data?
E.g. think about: surveillance, informed consent, privacy
A force for good or for evil?

Some people are very optimistic about the possibilities offered by 'Smart Cities' (e.g. Batty, 2012).
Opportunities
A deeper understanding of how urban systems function (at least in the short term).
Manage disruption / emergencies - understand points of failure
Improve quality of life
Manage burgeoning urban populations
Democratisation of urban management (through public data)
A force for good or for evil?
But others are less optimistic (e.g. Galdon-Clavell, 2013).

Risks
How to align 'smart cities' with
informed consent
privacy and data protection
dual use
non-discrimination
Risks of abuse (big brother)
E.g. "Surveillance ... has challenged and undermined the right of all humans to "remain unobserved and unmolested" in their thoughts, personal environments and communications." (The Guardian, 2013).
Market driven, anti-democratic
This all sounds awesome, but have you spotted the flaw in the plan? In such a smart city, the control systems would all be programmed, installed and managed by IBM and CISCO. These private companies would have huge, billion-dollar contracts to manage the biggest cities in the world. When Ops Centres around the world are eventually automated, IBM's software will effectively become your digital mayor - or tyrant. ... IBM would become a de facto member of the government. After all, politicians might tell IBM how they want a city to be run, but it's IBM's implementation that ultimately matters. A new law might decree that smart cars travelling in smart cities must be limited to 30 mph - but what if IBM disagrees, or says the system doesn't have that capability, or simply takes six months to implement the change?(Anthony, 2012).
Outline
Conclusions
Abundance of new data, already being exploited by businesses
Potentially use these data to better understand urban dynamics and human behaviour
This can, and should, inform our models
Lots of examples of new 'smart cities' initiatives
ABM will form a significant part of these initiatives
Ultimately improve quality of life (?)
Big questions around data protection, privacy, ethics and surveillance.
Further Reading
Here are some of the key texts for the lecture.
Mayer-Schonberger, V. and Cukier, K. (2013) Big Data: A Revolution That Will Transform How We Live, Work, and Think. John Murray
The "Big Data book" is quite famous and gives a great overview of many of the issues associated with the big data "revolution" (to quote the authors). It's also very readable.
Anderson, C., 2008. The End of Theory: The Data Deluge Makes the Scientific Method Obsolete. WIRED. Available online
Anderson's article in Wired magazine, in which he suggests that data are now so abundant that we no longer need theories to understand why things happen, was controversial and widely criticised. He makes an interesting argument, even if it is one he has since stepped away from.
Savage, M. and Burrows, R., 2007. The Coming Crisis of Empirical Sociology. Sociology 41, 885-899.
Savage and Burrows discuss the impact that huge new data sources will have on a field that has traditionally prided itself on developing statistical methods that work with small amounts of neat, well structured data.
Birkin, M., Malleson, N., (2013) Investigating the Behaviour of Twitter Users to Construct an Individual-Level Model of Metropolitan Dynamics. National Centre for Research Methods (NCRM) Working Paper 05/13. University of Leeds.
We discuss how messages posted to messages posted to Twitter can be used enrich our understanding of activity patterns in urban areas.
Batty, M., 2012. Smart cities, big data. Environment and Planning B: Planning and Design 39, 191-193. Link.
A very optimistic view of possibilities offered by big data for understanding cities.
Galdon-Clavell, Gemma (2013). (Not so) smart cities?: The drivers, impact and risks of surveillance-enabled smart environments. Science and Public Policy Online first.
A somewhat less optimistic take on smart cities.
Goodchild M (2007). Citizens as Sensors: the World of Volunteered Geography, GeoJournal, 211-221. Link.
Discusses the concept of Volunteered Geographical Information (VGI) - geographical information created by citizens.
Other Resources
Here are some good videos, news reports, etc. that are worth watching. Particularly relevent for Smart Cities.
Kent Larson: Brilliant designs to fit more people in every city. TED talk.
A talk about designing modern cities. Discusses some interesting new research aimed at making cities more efficient and user-friendly.
BBC: Tomorrows Cities http://www.bbc.co.uk/news/technology-23517670
A series of reports exploring 'smart cities' innovations. In particular, this video looks at the ways that London is becoming a 'smart city'.
Wakefield, J. 2013. Tomorrow's cities: How big data is changing the world. BBC News. [Online]. Available from: Available online
A BBC news piece about big data and smart cities
BBC. 2013. Horizon - The Age of Big Data. Available on YouTube: http://www.youtube.com/watch?v=EsVy28pDsYo
BBC documentary that covers some of the new applications of big data. In particular, there is a section on how the L.A. Police Department are being directed by algorithms (developed by Jeff Brantingham's UC MASC Project) that predict emerging hot spots (often called Predictive Policing).
References
Anderson, C., 2008. The End of Theory: The Data Deluge Makes the Scientific Method Obsolete. WIRED. Available online
Andresen, M.A., Jenion, G.W., Reid, A., (2012). An Evaluation of Ambient Population Estimates for Use in Crime Analysis. Crime Mapping: A Journal of Research and Practice 4, 8–31.
Batty, M. (2005). Agents, cells, and cities: new representational models for simulating multiscale urban dynamics. Environment and Planning A, vol. 37, pp. 1373-1394, 2005.
Batty, M., 2012. Smart cities, big data. Environment and Planning B: Planning and Design 39, 191-193. Link.
Batty, M., Axhausen, K.W., Giannotti, F., Pozdnoukhov, A., Bazzani, A., Wachowicz, M., Ouzounis, G., Portugali, Y., 2012. Smart cities of the future. The European Physical Journal Special Topics 214, 481Ð518. doi:10.1140/epjst/e2012-01703-3
Birkin, M., Malleson, N., (2013) Investigating the Behaviour of Twitter Users to Construct an Individual-Level Model of Metropolitan Dynamics. National Centre for Research Methods (NCRM) Working Paper 05/13. University of Leeds.
Boggs, S.L. (1965). Urban Crime Patterns. American Sociological Review 30, 899–908. doi:10.2307/2090968
Galdon-Clavell, Gemma (2013). (Not so) smart cities?: The drivers, impact and risks of surveillance-enabled smart environments. Science and Public Policy Online first.
A somewhat less optimistic take on smart cities.
Goodchild M (2007). Citizens as Sensors: the World of Volunteered Geography, GeoJournal, 211-221. Link.
Laney, D. (2001). 3D data management: Controlling data volume, velocity and variety. META Group Research Note, 6.
Madden, S. (2012). From Databases to Big Data. Internet Computing, IEEE, 16(3), 4=6. doi:10.1109/MIC.2012.50
Mayer-Schonberger, V. and Cukier, K. (2013) Big Data: A Revolution That Will Transform How We Live, Work, and Think.John Murray
Tatonetti, N.P., Denny, J.C., Murphy, S.N., Fernald, G.H., Krishnan, G., Castro, V., Yue, P., Tsau, P.S., Kohane, I., Roden, D.M., Altman, R.B., 2011. Detecting Drug Interactions From Adverse-Event Reports: Interaction Between Paroxetine and Pravastatin Increases Blood Glucose Levels. Clinical Pharmacology and Therapeutics 90, 133Ð142. doi:10.1038/clpt.2011.83
Savage, M. and Burrows, R., 2007. The Coming Crisis of Empirical Sociology. Sociology 41, 885-899.