CUPUM 2025
Extracting Key Urban Footfall Signatures using Principal Component Analysis
Jack Liddle, Wenhua Jiang and Nick Malleson
School of Geography, University of Leeds
The Alan Turing Institute
These slides: www.nickmalleson.co.uk/presentations.html
This project has received funding from the European Research Council (ERC) under the European Union’s Horizon 2020 research and innovation programme (grant agreement No. 757455)
Paper recently published
Liddle, J., W. Jiang, and N. Malleson (2025). Leveraging Principal Component Analysis to Uncover Urban Pedestrian Dynamics. Journal of Geographical Systems DOI: 10.1007/s10109-025-00469-0

Photo attributed to bobarcpics (CC BY 2.0)
Overview
Footfall data: counts of pedestrians
Context: A better understanding of urban dynamics through the analysis of footfall data
Principal Component Analysis to isolate key temporal patterns at various urban locations
Identify surprisingly clear patterns
Better understand the evolution of urban footfall dynamics
Context: Footfall Dynamics
Data
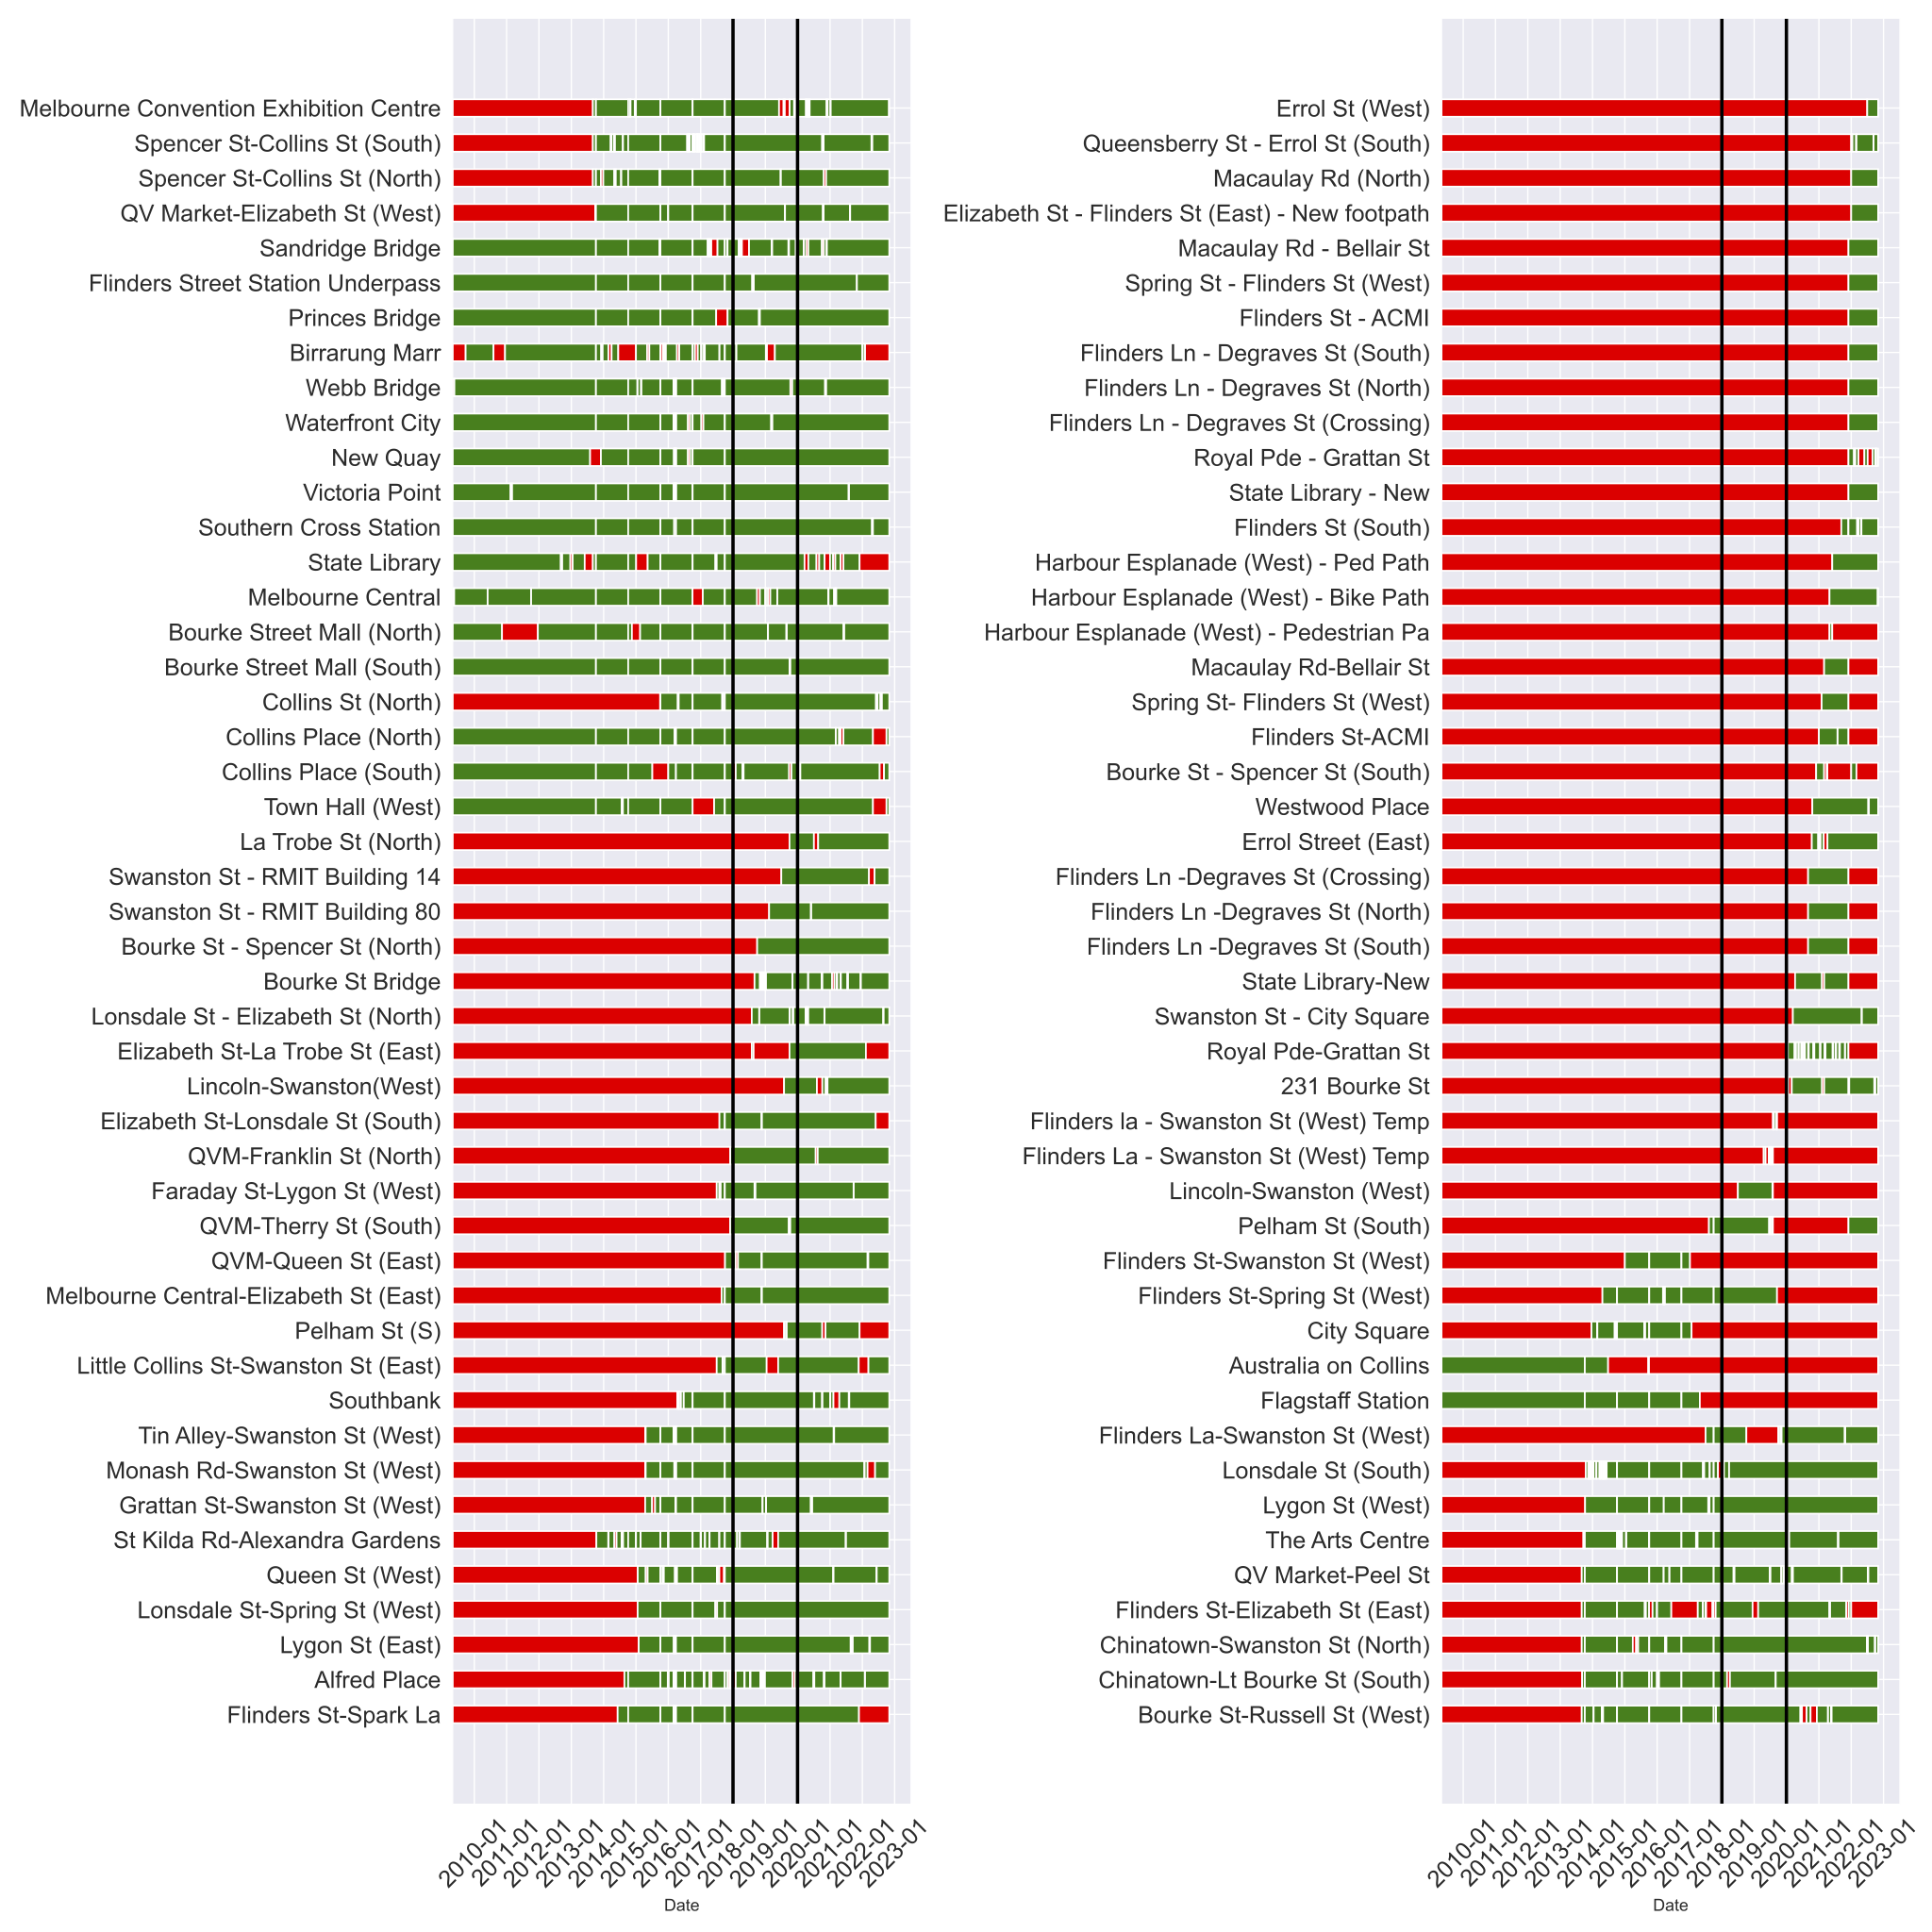
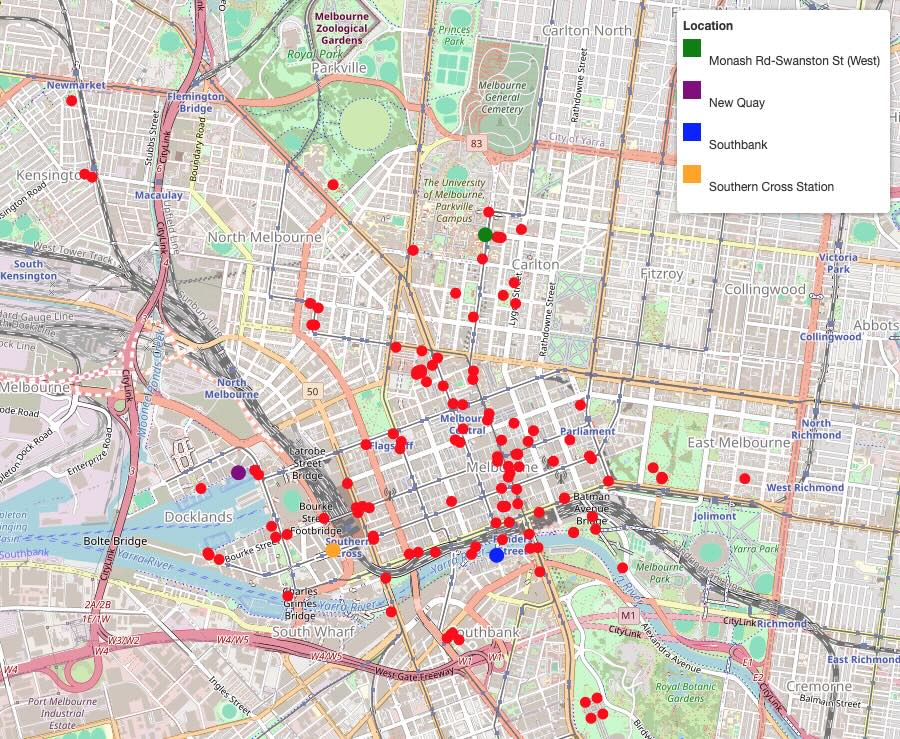
Melbourne Footfall Counters
Fantastic data available through the Melbourne Open Data Portal
Footfall counters
94 sensors counting hourly footfall, some date back to 2009
We use 24 months of data (all of 2018 and 2019, avoiding COVID)
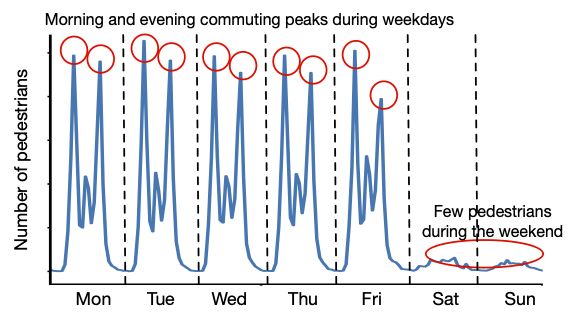
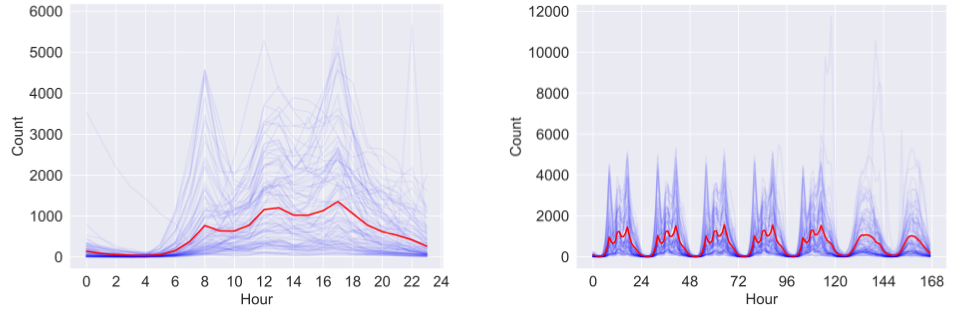
Footfall Data
Mean daily and weekly footfall counts
Some regularity but also huge variation
Principal Component Analysis (PCA)
Technique for reducing dimensionality in datasets
Isolate significant features; the 'principal components'
Raw data can be approximated by a linear combination of component loadings
Here: components are vectors of length 24 (or 168 if we look at weeks)
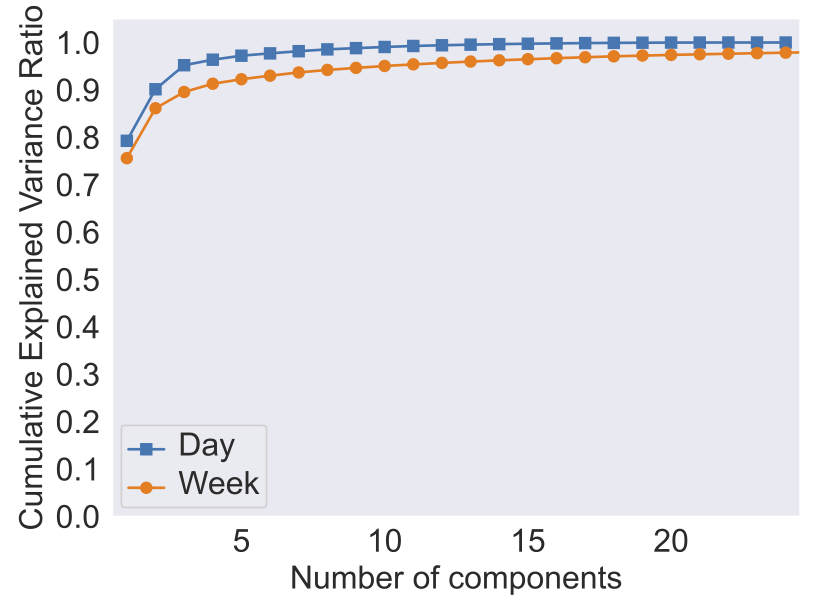
How many principal components?
Proportion of explained variance
Results (i): Most Important Components
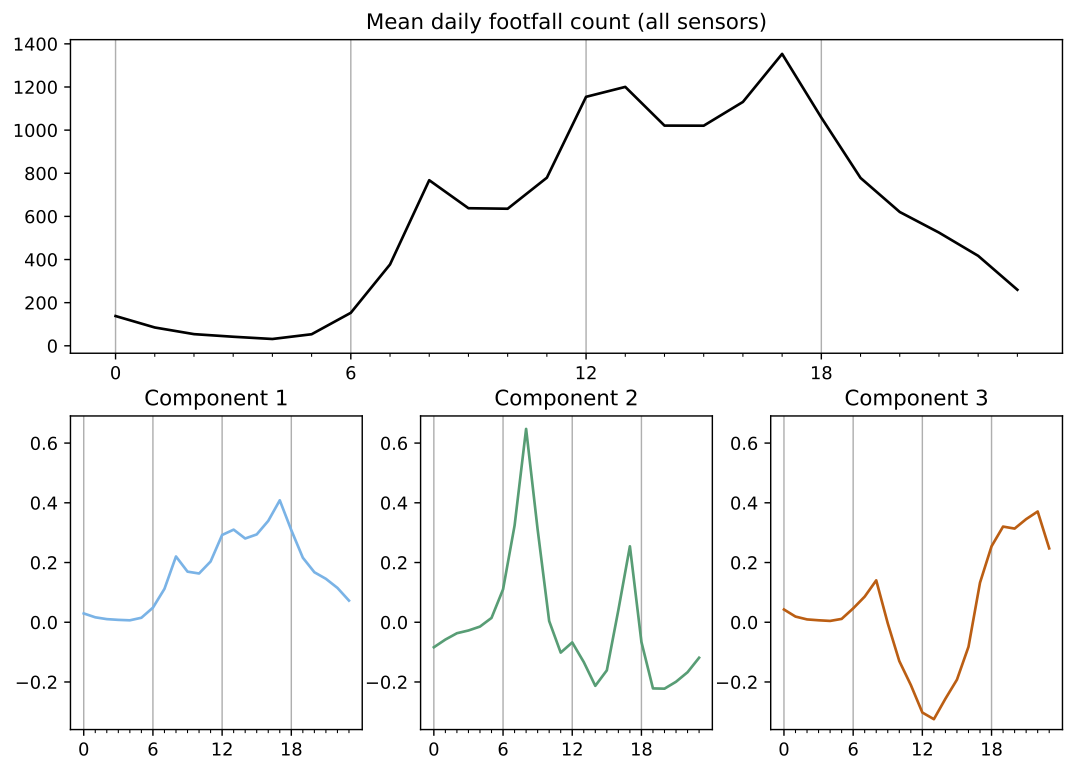
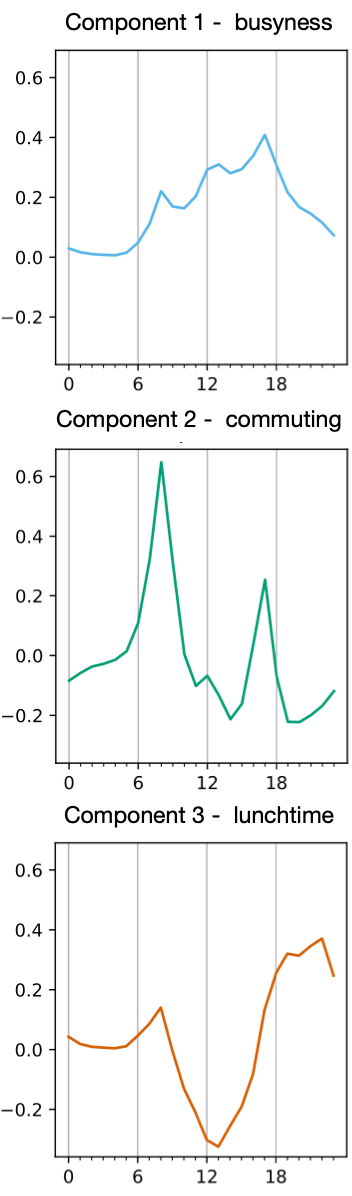
Most Important Components
Component 1 - busyness
Almost identical to mean daily activity
Busy places: component loadings > 1
Quiet places: component loadings < 1
Component 2 - commuting
Peaks in the morning and afternoon - typical rush hour
Component loadings represent presence of commuters
Component 3 - lunchtime suppression
Suppresses activity in the middle of the day and increase it over lunch
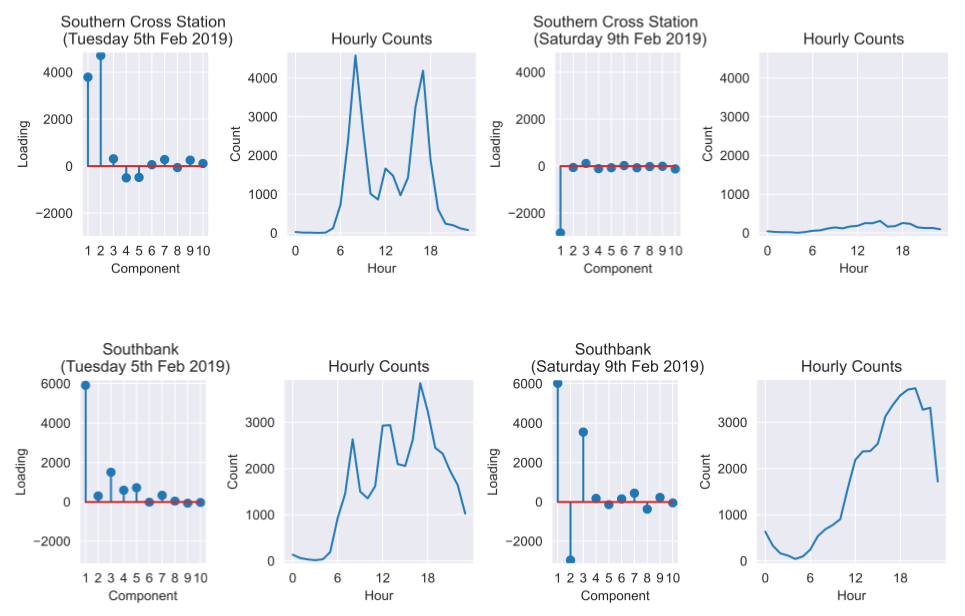
Results (ii) Component Loadings
Examples: Southern Cross Station and Southbank
Results (iii): Component Interactions
UrbanUsageSpaceDemoDays.html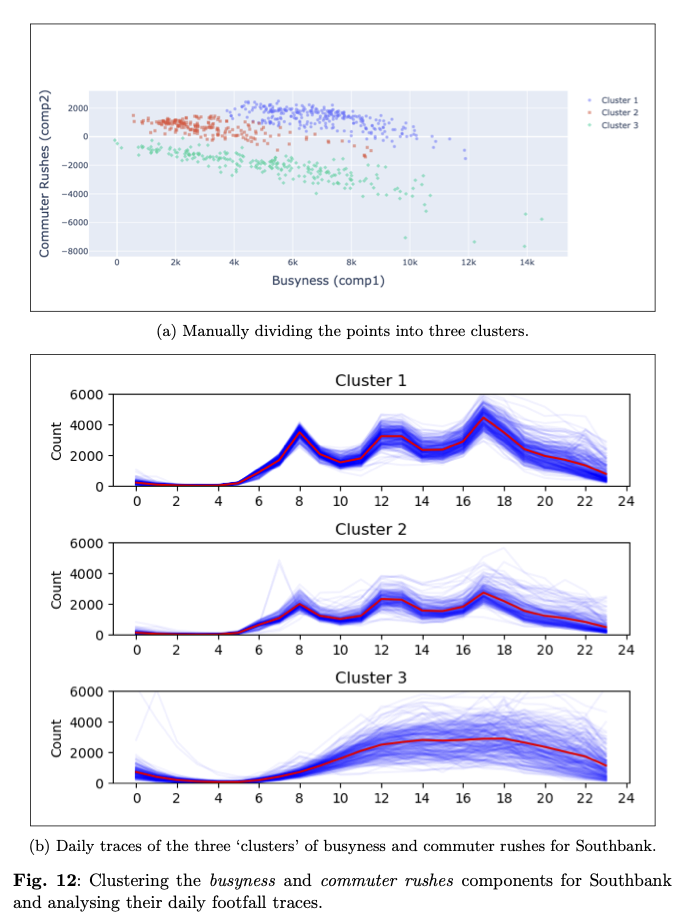
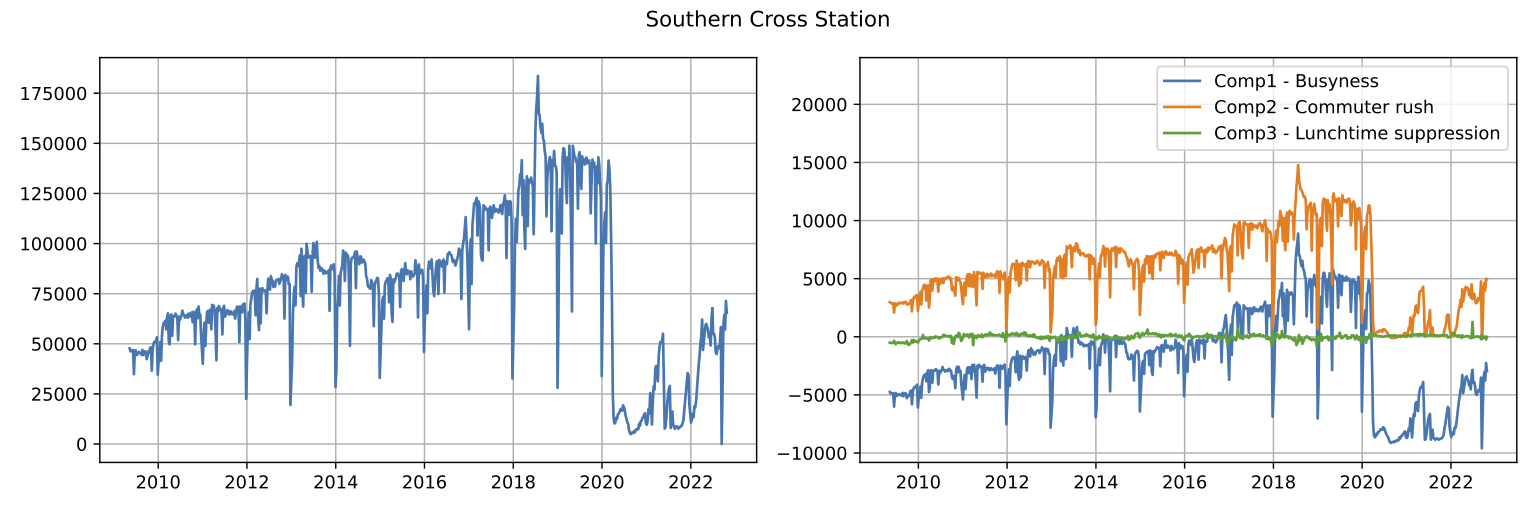
Results (iv): Evolution of Usage Patterns
Southern Cross
Commuting is largest driver of footfall; still lower than pre-pandemic levels
Additional footfall might be encouraged by making it attractive to commuters
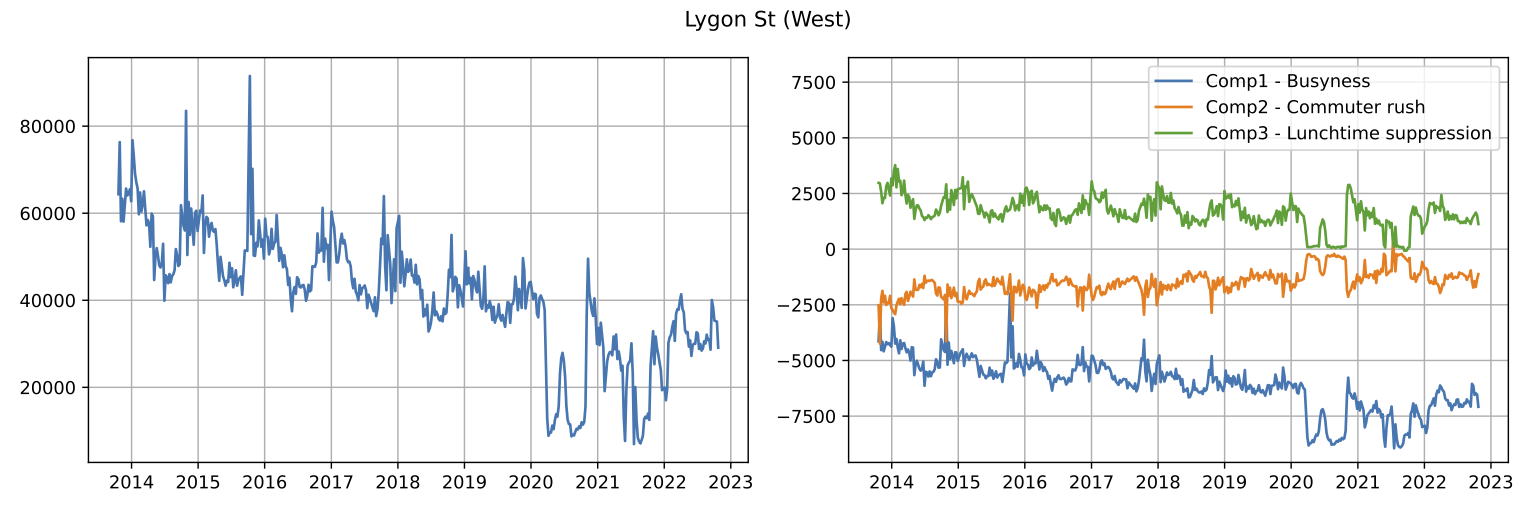
Results (iv): Evolution of Usage Patterns
Lygon St
Steady decline in busyness, but a gradual increase in commuting?
Possible transition towards a more commuting-oriented area
Summary / Conclusions
Application of PCA to investigate (spatio-)temporal footfall trends
Drawbacks: validation of activities; equity in sensor location
Opportunities to:
better understand use of the build environment
explore evolution of activities over time
cluster places / times based on activity structure
explore relationships between components
Many implications for policy making
CUPUM 2025
Extracting Key Urban Footfall Signatures using Principal Component Analysis
Jack Liddle, Wenhua Jiang and Nick Malleson
School of Geography, University of Leeds
The Alan Turing Institute
These slides: www.nickmalleson.co.uk/presentations.html
This project has received funding from the European Research Council (ERC) under the European Union’s Horizon 2020 research and innovation programme (grant agreement No. 757455)