New Insights into Individual Activity Spaces using Crowd-Sourced Big Data
Presentation to Big Data Science
Stanford, CA, USA, May 27 - May 31, 2014
Dr Nick Malleson and Prof. Mark Birkin
School of Geography, University of Leeds
http://nickmalleson.co.uk/
http://www.geog.leeds.ac.uk/people/n.malleson
Slides: http://bit.ly/1jrYInL
Outline
Context: Towards a model of daily urban dynamics
Background and theoretical frameworks
Space-time geographies
Awareness / activity spaces
Relevant research
Data and the study area
Method
Estimating anchor points
Textual analysis
Results and Conclusions
Context
Excellent residential (night-time) population data (from censuses etc.).
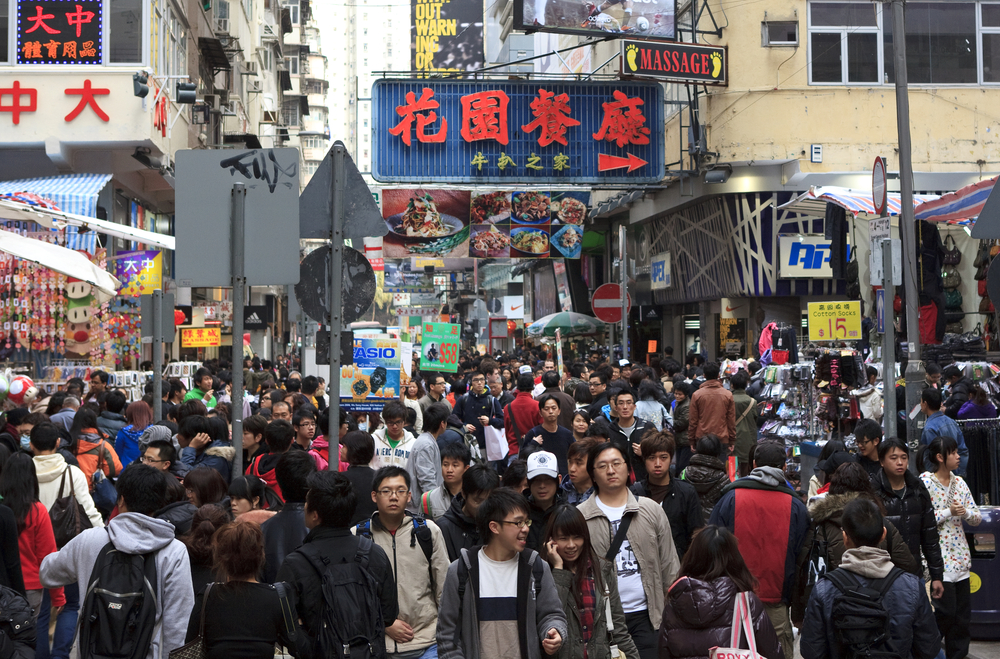
But limited ambient (day-time) population data.
Ambient population is relevant to diverse fields:
Disease spread / mitigation
Transport planning
Pollution / disease burdens
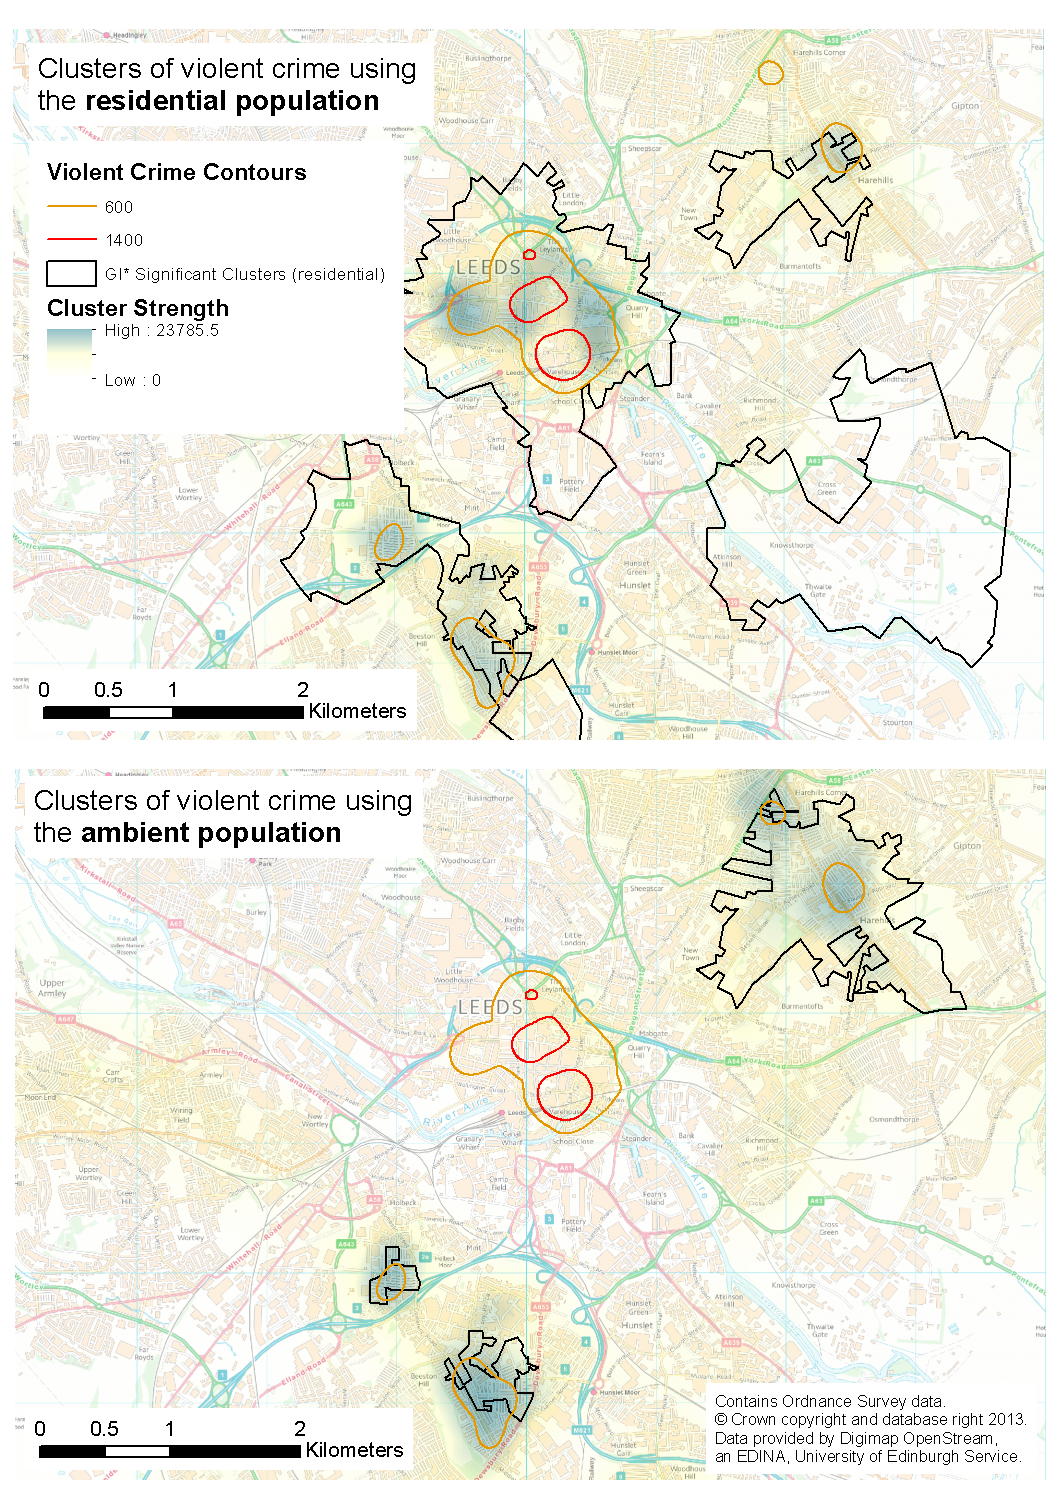
Crime (e.g. [13])
. . .
Research Aims
Evaluate the extent to which crowd-sourced data can be used to gain insight into the individual activity spaces (the places that individuals visit on a regular basis)
Identify the functions of different anchor points
Background: Space-Time Geography
Cities characterised as complex systems (e.g. [1])
Aggregate smoothing of underlying dynamism
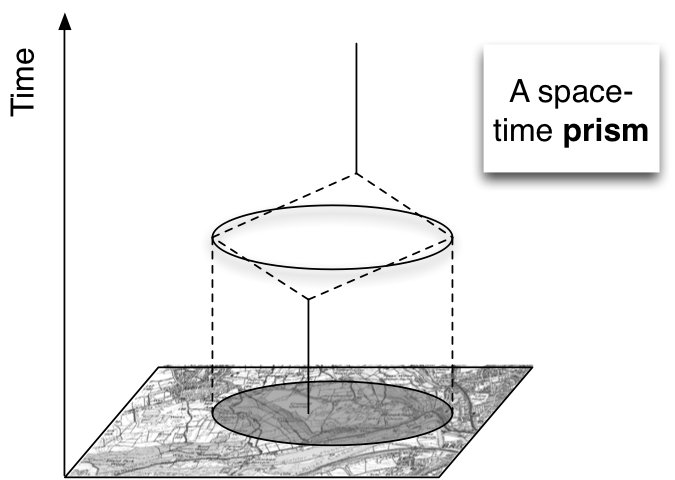
Theories exploring spatio-temporal movement constraints
E.g. Time Geography [2]
Better understanding of:
Who visits particular locations
Which other locations have those people visited
Who might they have met during their journey
Background: Activity Spaces and Anchor Points
First step towards a more realistic model of individual behaviour
Activity spaces
The spaces in which an individual's normal activity occurs
Anchor points
Important individual locations (home, work, school, etc.).
Central pillar for diverse disciplines (e.g. criminology, geography)
Very difficult to quantify
New opportunities offered by 'big' crowd-sourced
Big Data: from a geographer's perspective
Traditional data
UK census: ~2000 output areas in Leeds
Microsimulation: ~800,000 individuals
Our twitter data: ~2M points
Big Data = "It won't open in Excel!"
New data...
Mobile telephones: ~5Bn events daily
Public transport journeys (Oyster): 3.5M daily tube journeys (not including busses, cycle hire, etc.)
As well as volume, there are difficulties with velocity and variety
Big Data: from a geographer's perspective
Similar to fourth paradigm data intensive research [3] in the physical sciences
"Crisis" in "empirical sociology" [4]
"One of the areas that is being most dramatically shaken up by N = all is the social sciences. They have lost their monopoly of making sense of empirical social data, as big data analysis replaces the highly skilled survey specialists of the past. .. When data is collective passively while people do what they normally do anyway, the old biases associated with sampling and questionnaires disappear." [5]
Data and the Study Area
Leeds, UK
Large city in north England
Population 757,655 (in 2012)
Central shopping / leisure / commercial area
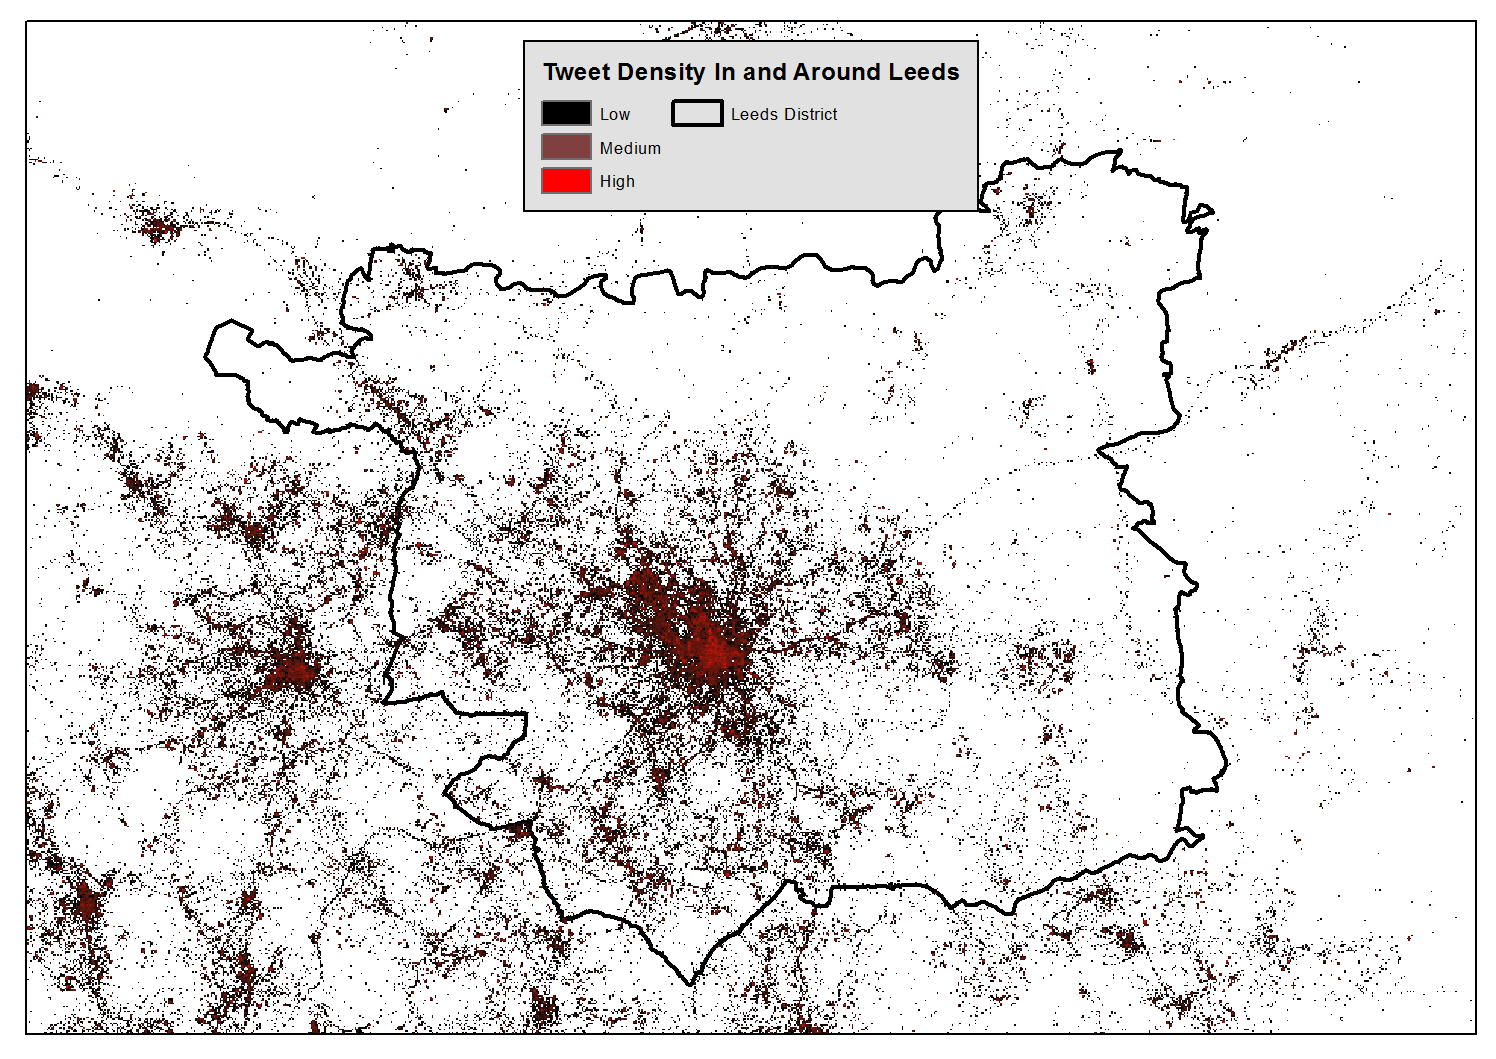
Social media data
Geo-located Twitter messages from 22 June 2011 to 14 April 2013
N=1,955,655 (after cleaning)
Stage 1 - Extract prolific users
Those with 50+ messages in the data
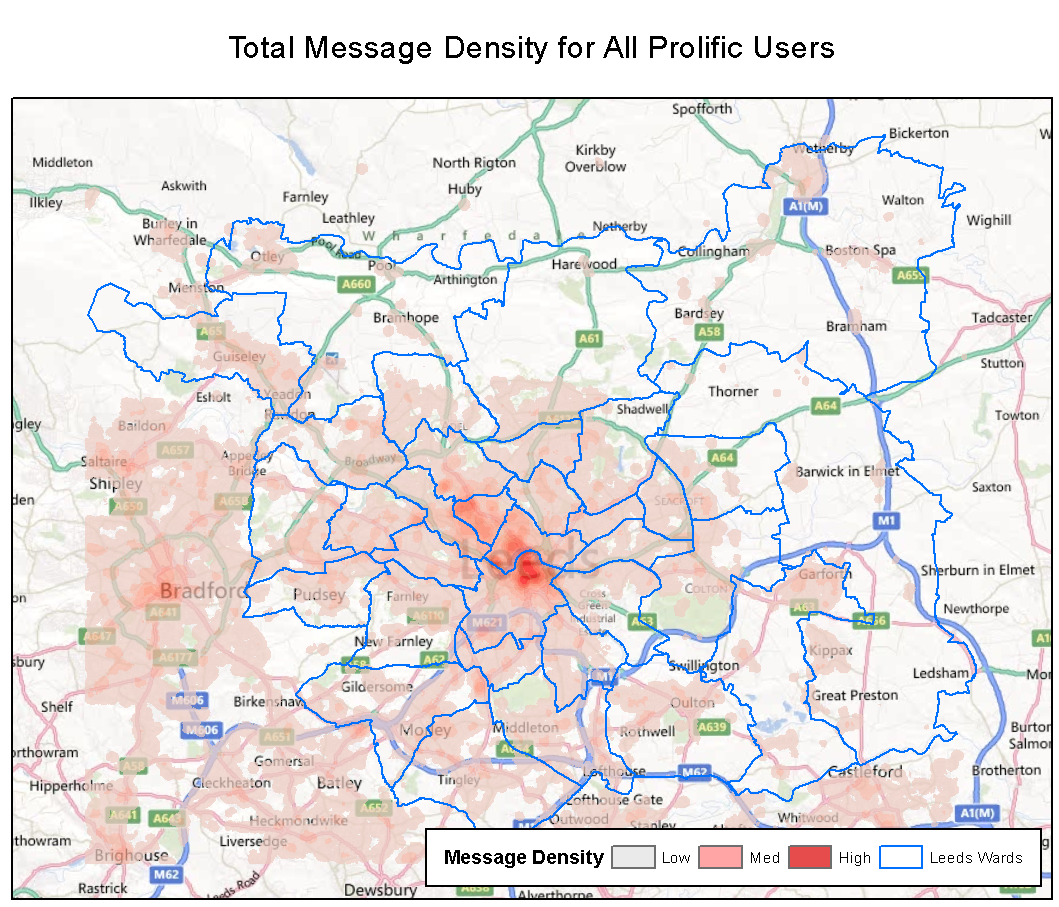
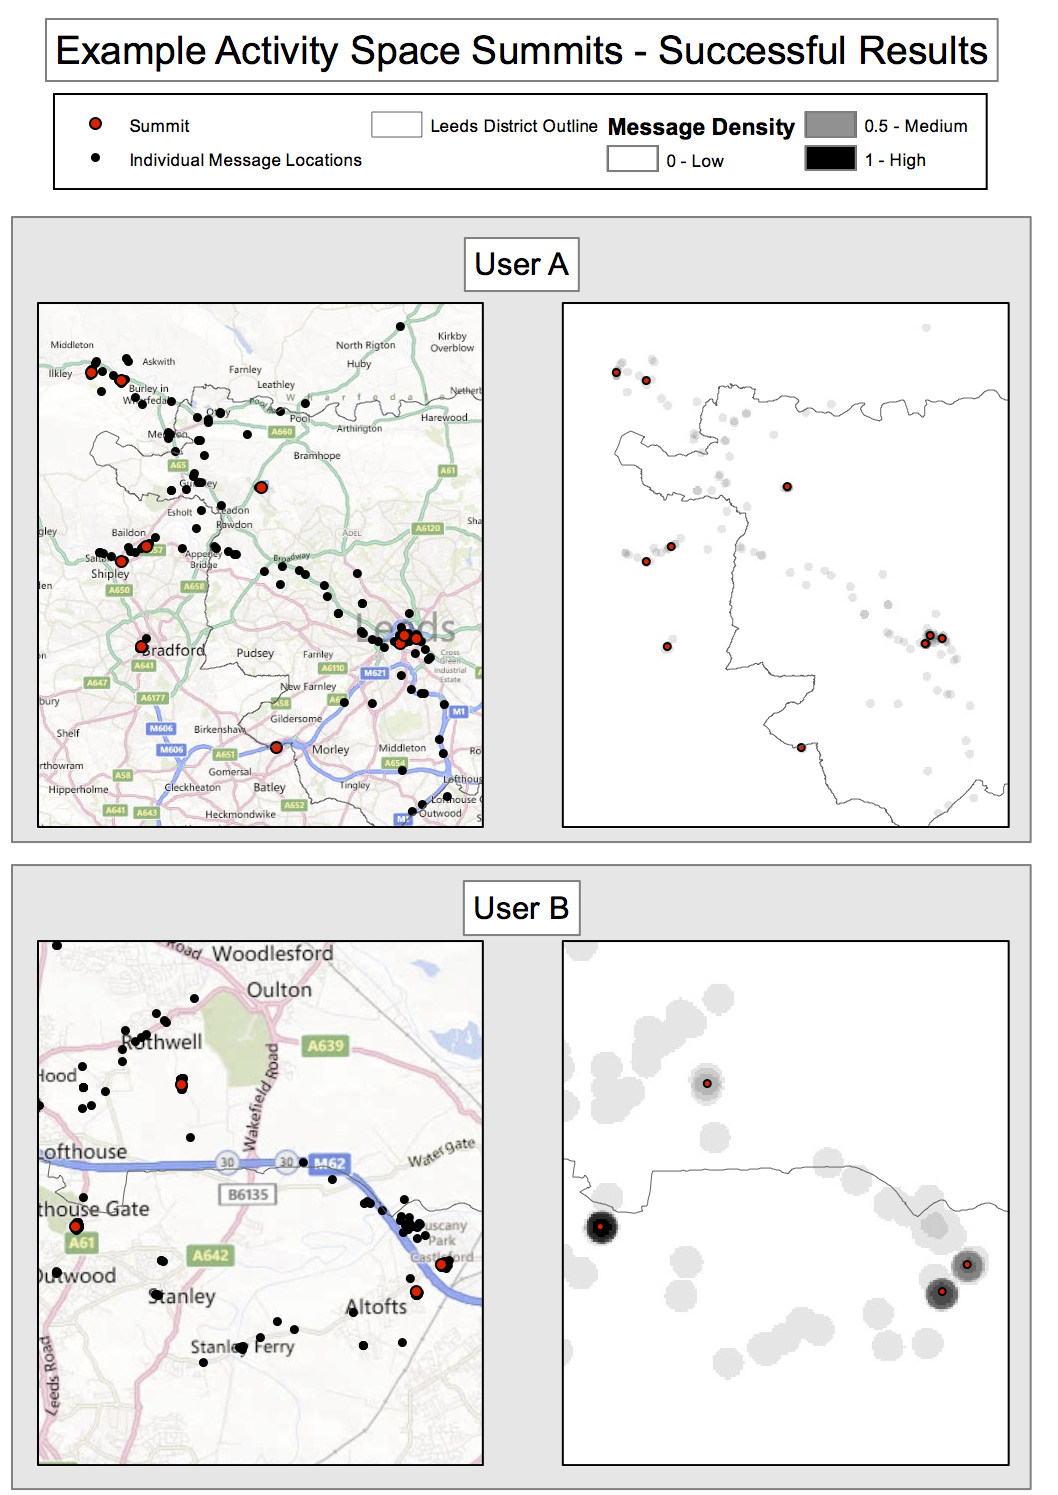
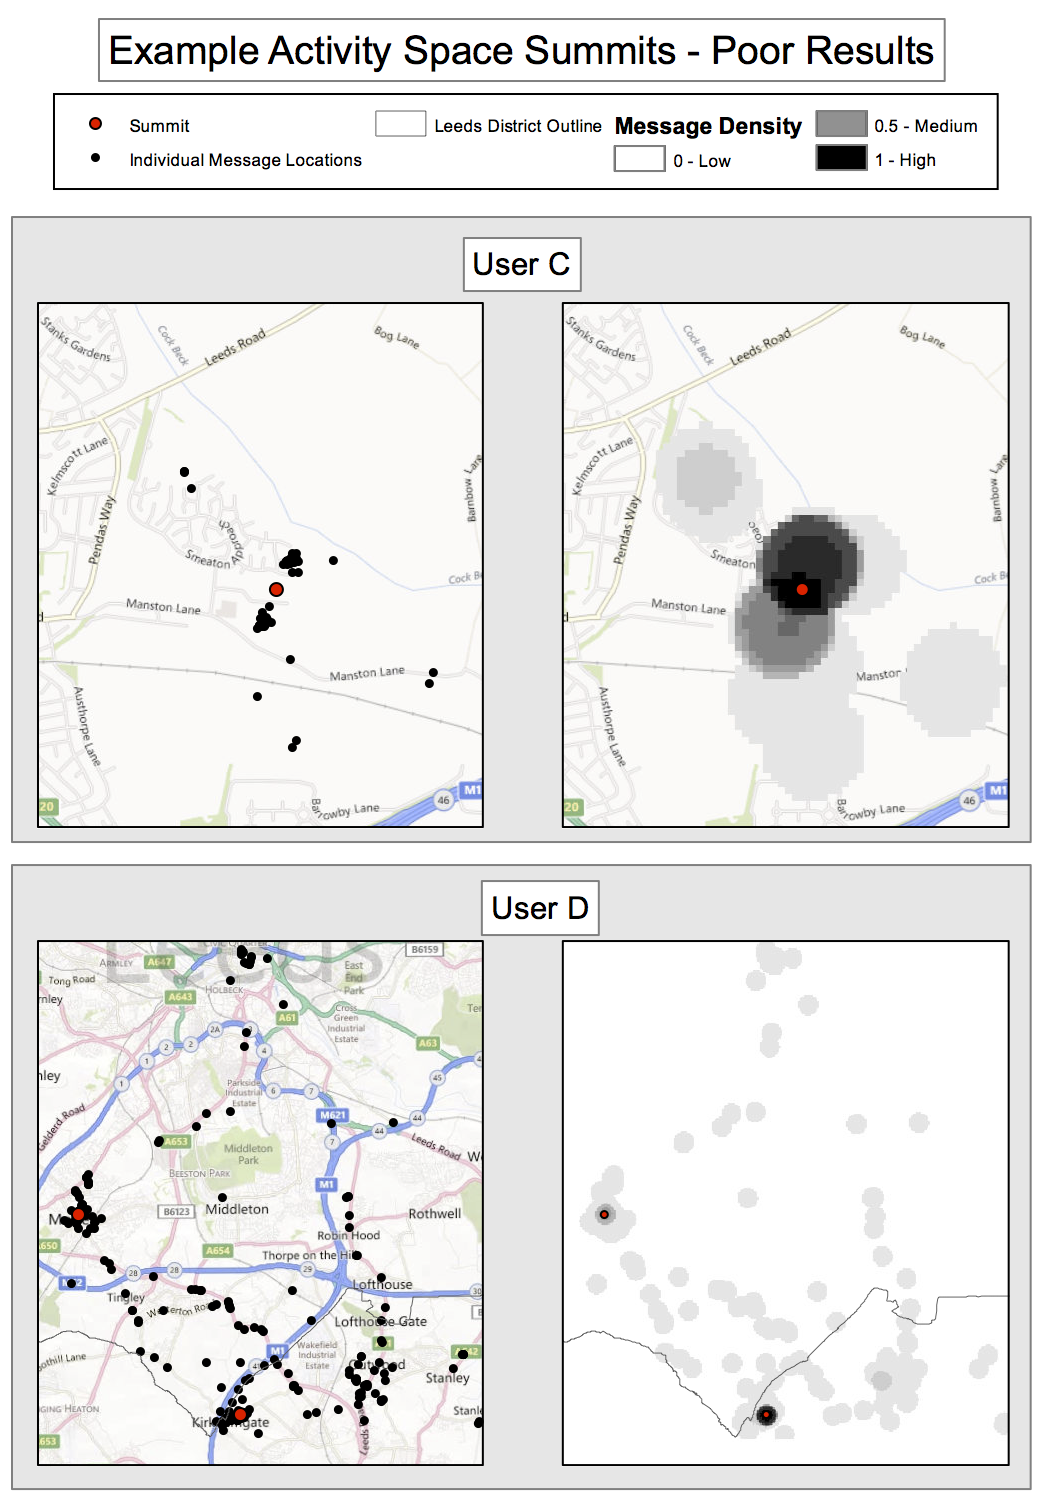
Stage 2 - Generate a message density surface
Kernel density estimation
Highlight areas with high spatial message density for individual users
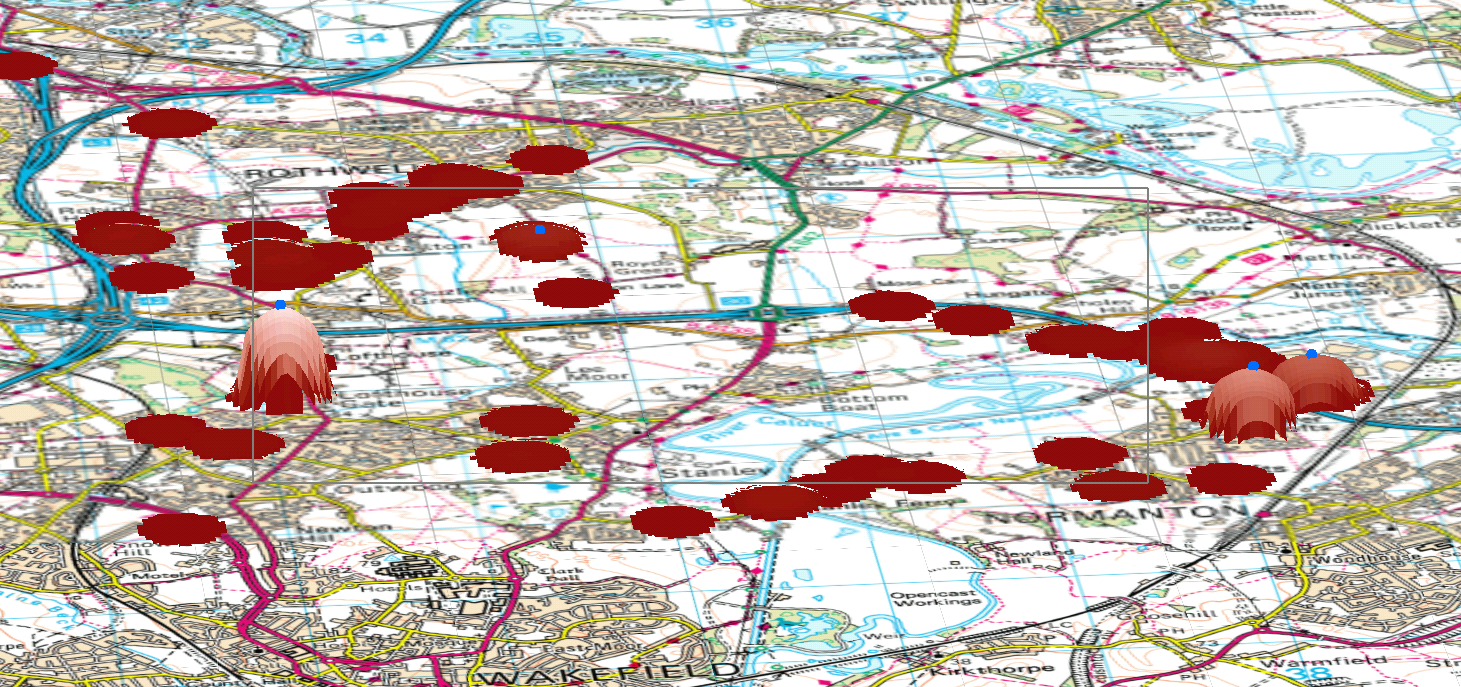
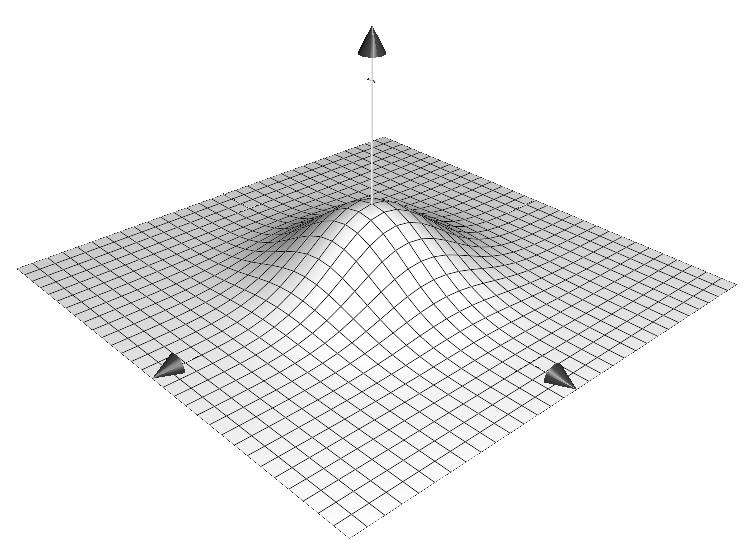
Stage 3 - Identify areas of 'unusually' high density (anchor points)
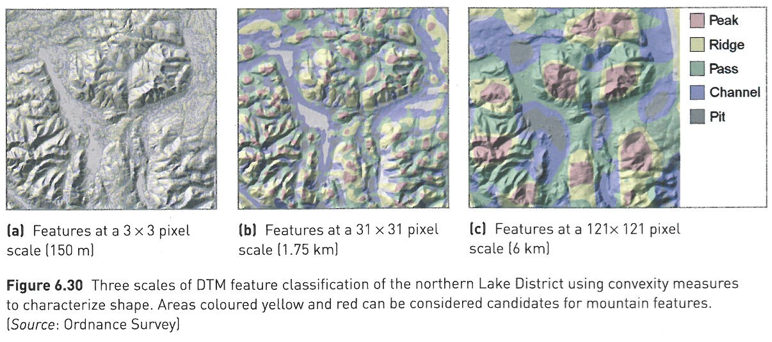
GIS method used to identify peaks in digital elevation data
Use Landserf free software (Java) [11]
Anchor points are centres of peaks
Assume highest peak is 'home'
Stage 4 - Analysing place functions
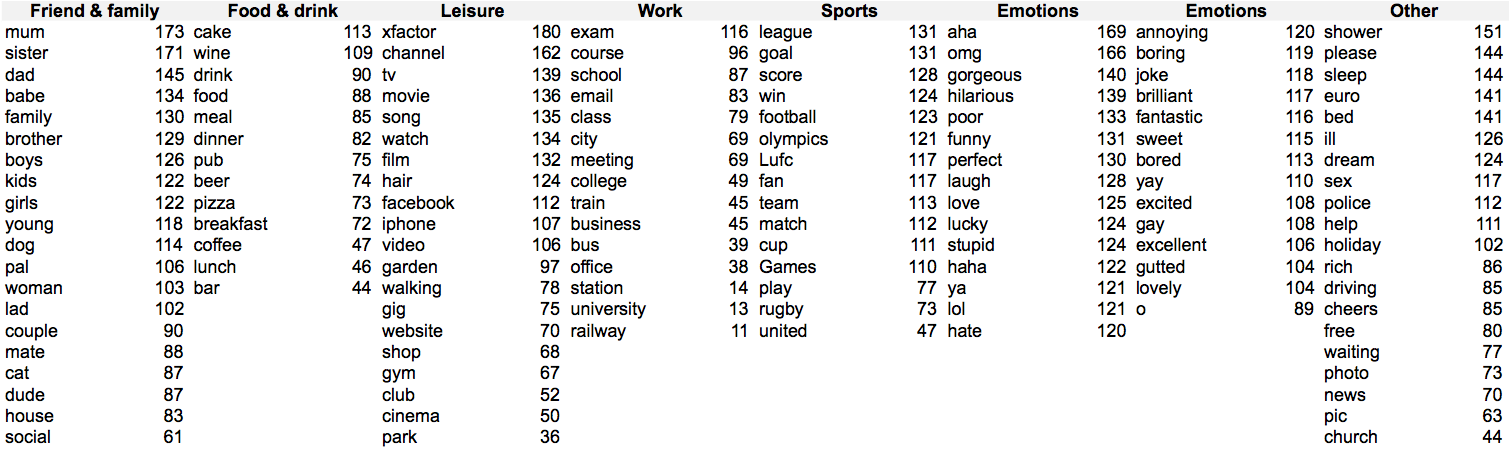
Identify words with distinction spatio-temporal profiles [12]
Calculate 'domestic skew' - proportion of words that occur at 'home' locations compared to anywhere else ('away').
Summary / Conclusions
Explore awareness spaces / anchor points from social media data
Estimate 'home' locations
Some words clearly associated with 'home', others with 'away'
Severe limitations to the data, but future potential is promising.
Best available resource?
Future work
Further anlysis. Particularly:
Validation / verification to handle skew, representation, accuracy, bias
Comparison with other data (e.g. geodemogrpahics)
Identify additional activities (shopping, leisure, school, etc.).
National language processing
Leeds Institute for Data Analytics (LIDA) and the Consumer Data Research Centre (CDRC)
Similar Research
Classifying neighbourhoods based on social media contributions
LiveHoods (http://livehoods.org/) [6]
Functional profiles or areas [7]
Land use classification [8]
Identification of user 'patches' (regular activity and function) [9]
Anchor points in mobile phone data [10]
References
[1] M. Batty, "Agents, cells, and cities: new representational models for simulating multiscale urban dynamics," Environment and Planning A, vol. 37, pp. 1373-1394, 2005.
[2] T. Häagerstrand, "What about people in regional science?" Papers of the Regional Science Association, vol. 24, no. 1, pp. 6-21, 1970.
[3] Bell, G., Hey, T., Szalay, A., 2009. Beyond the data deluge. Science 323, 1297-1298. doi: 10.1126/science.1170411
[4] Savage, M, and R Burrows. 2007. "The Coming Crisis of Empirical Sociology." Sociology 41 (5): 885-899.
[5] Mayer-Schonberger, Viktor, and Kenneth Cukier. 2013. Big Data: A Revolution That Will Transform How We Live, Work and Think. John Murray.
[6] J. Cranshaw, R. Schwartz, J. Hong, and N. Sadeh, "The livehoods project: Utilizing social media to understand the dynamics of a city," in Sixth International AAAI Conference on Weblogs and Social Media 2012-05-20.
[7] F. Kling and A. Pozdnoukhov, "When a city tells a story: urban topic analysis," in Proceedings of the 20th International Conference on Advances in Geographic Infomation Systems, ser. SIGSPATIAL '12. ACM, 2012, pp. 482-485.
[8] V. Frias-Martinez, V. Soto, H. Hohwald, and E. Frias-Martinez, "Sensing urban land use with twitter activity," 2013. [ Online].
[9] Y. Qu and J. Zhang, "Regularly visited patches in human mobility," in Proceedings of the SIGCHI Conference on Human Factors in Computing Systems, ser. CHI '13. ACM, 2013, pp. 395-398.
[10] S. Isaacman, R. Becker, R. Caceres, S. Kobourov, M. Martonosi, J. Rowland, and A. Varshavsky, "Identifying important places in people's lives from cellular network data," in Pervasive Computing, ser. Lecture Notes in Computer Science, K. Lyons, J. High- tower, and E. M. Huang, Eds. Springer Berlin Heidelberg, 2011, no. 6696, pp. 133-151.
[11] Wood, J. "Identifying Mountains with GIS". In Heywood, I., Cornelius, S. and Carver, S. An Introduction to Geographical Information Systems. 2011. Prentice Hall
[12] M. Birkin, K. Harland, and N. Malleson, "The classification of space-time behaviour patterns in a british city from crowd-sourced data," in Computational Science and Its Applications - ICCSA 2013 , ser. Lecture Notes in Computer Science, B. Murgante, S. Misra, M. Carlini, C. M. Torre, H.-Q. Nguyen, D. Taniar, B. O. Apduhan, and O. Gervasi, Eds. Springer Berlin Heidelberg, 2013, no. 7974, pp. 179-192.
[13] Malleson, N and M. Andresen. "The impact of using social media data in crime rate calculations: shifting hot spots and changing spatial patterns.Cartography and Geographical Information Society (CaGIS).